VergeOS Hands-On Lab
Getting Started

Getting Started with VergeOS: Overview
This first course is intentionally simple and is designed to establish the foundation for all subsequent labs. The lab introduces the initial steps with VergeOS, including logging in, changing the GUI theme, creating a virtual machine, protecting it with a snapshot policy, and applying tags for organization.
This course does not focus on explaining every interface detail or exploring advanced configuration options. Instead, the objective is to build familiarity with navigating VergeOS and completing a small set of essential tasks. As later courses progress, more advanced capabilities of the GUI, automation tools, and system operations are introduced and expanded upon.
By the end of this lab, a small but fully functional environment is in place, serving as a personal data center for use throughout the remainder of the VergeOS Hands-On Labs series.
You’ll learn how to:
- Log in and configure the VergeOS interface
- Create and assign a snapshot policy
- Create organizational tags
- Deploy and protect Windows and Linux virtual machines
- Verify configuration and relationships between snapshots, tags, and VMs
Prerequisites
- Access to a VergeOS instance
- Valid login credentials
- A modern web browser
Part 1 Logging In and Configuring the Interface
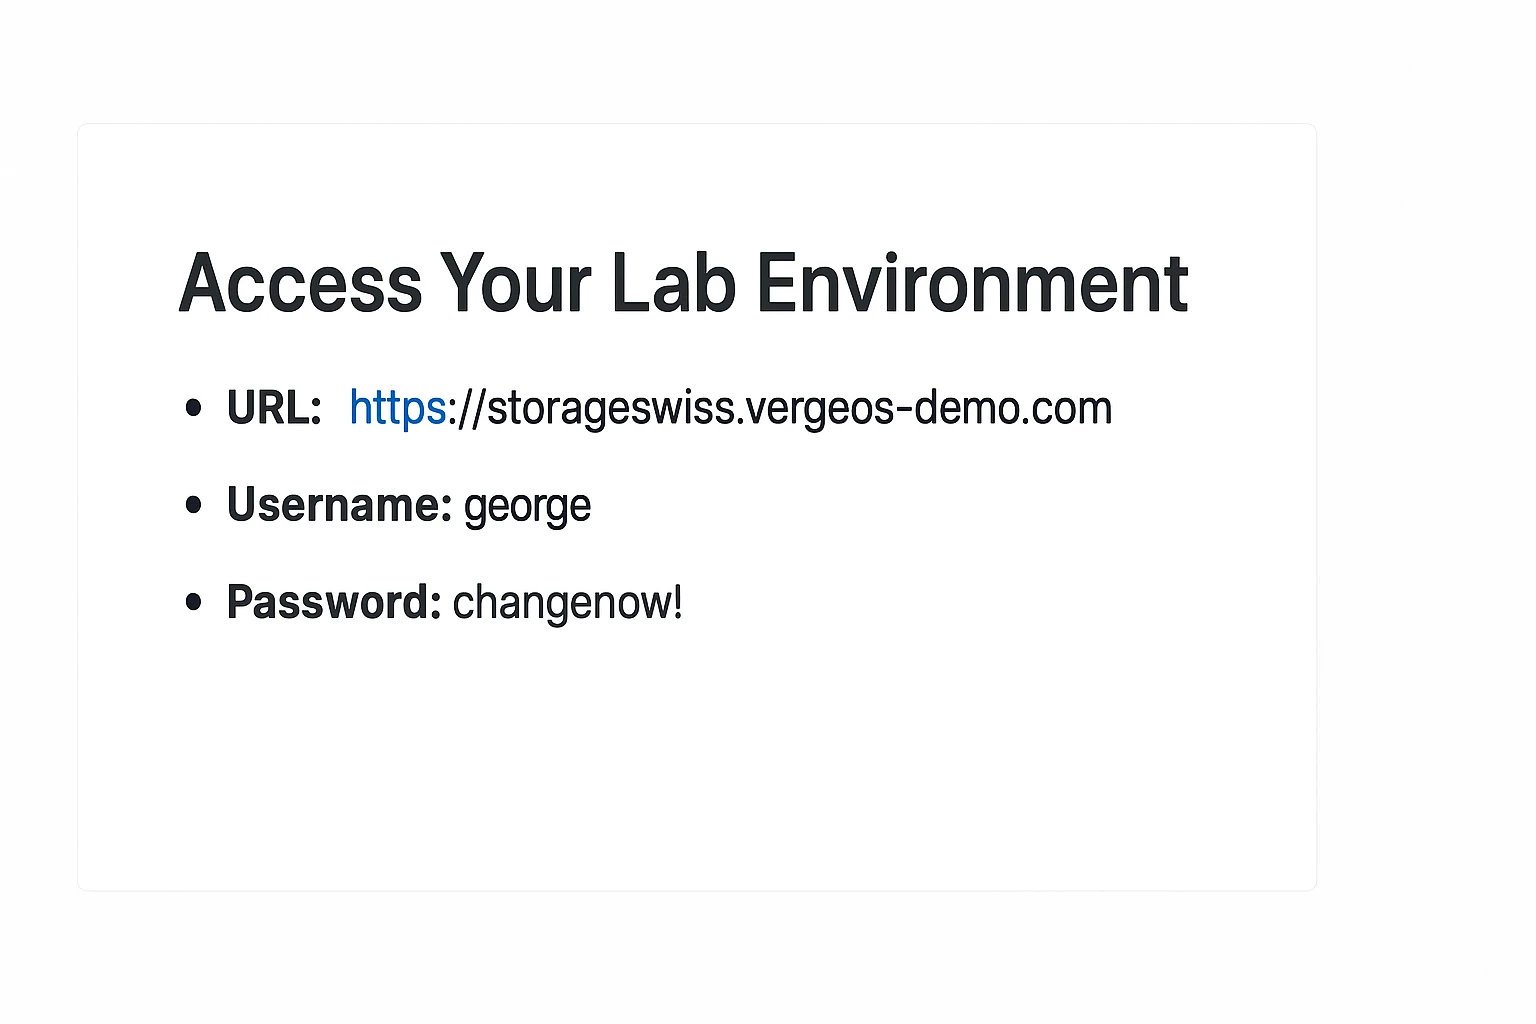
In the email you received with this guide, you will find a section titled "Access Your Lab Environment."
Step 1: Log In to VergeOS
1. Navigate to your VergeOS instance URL.
2. Enter your username and password.
3. Click Log In.
• You’ll arrive at the Dashboard, displayed in Light Mode by default.
Step 2: Switch to Dark Mode
1. Look at the top menu bar for the row of icons.
2. Find the sun icon and click the small disclosure arrow next to it.
3. Select the moon icon or choose “Dark.”
4. The interface will switch to dark mode.
Note: This lab uses dark mode in examples, but either theme is fine.
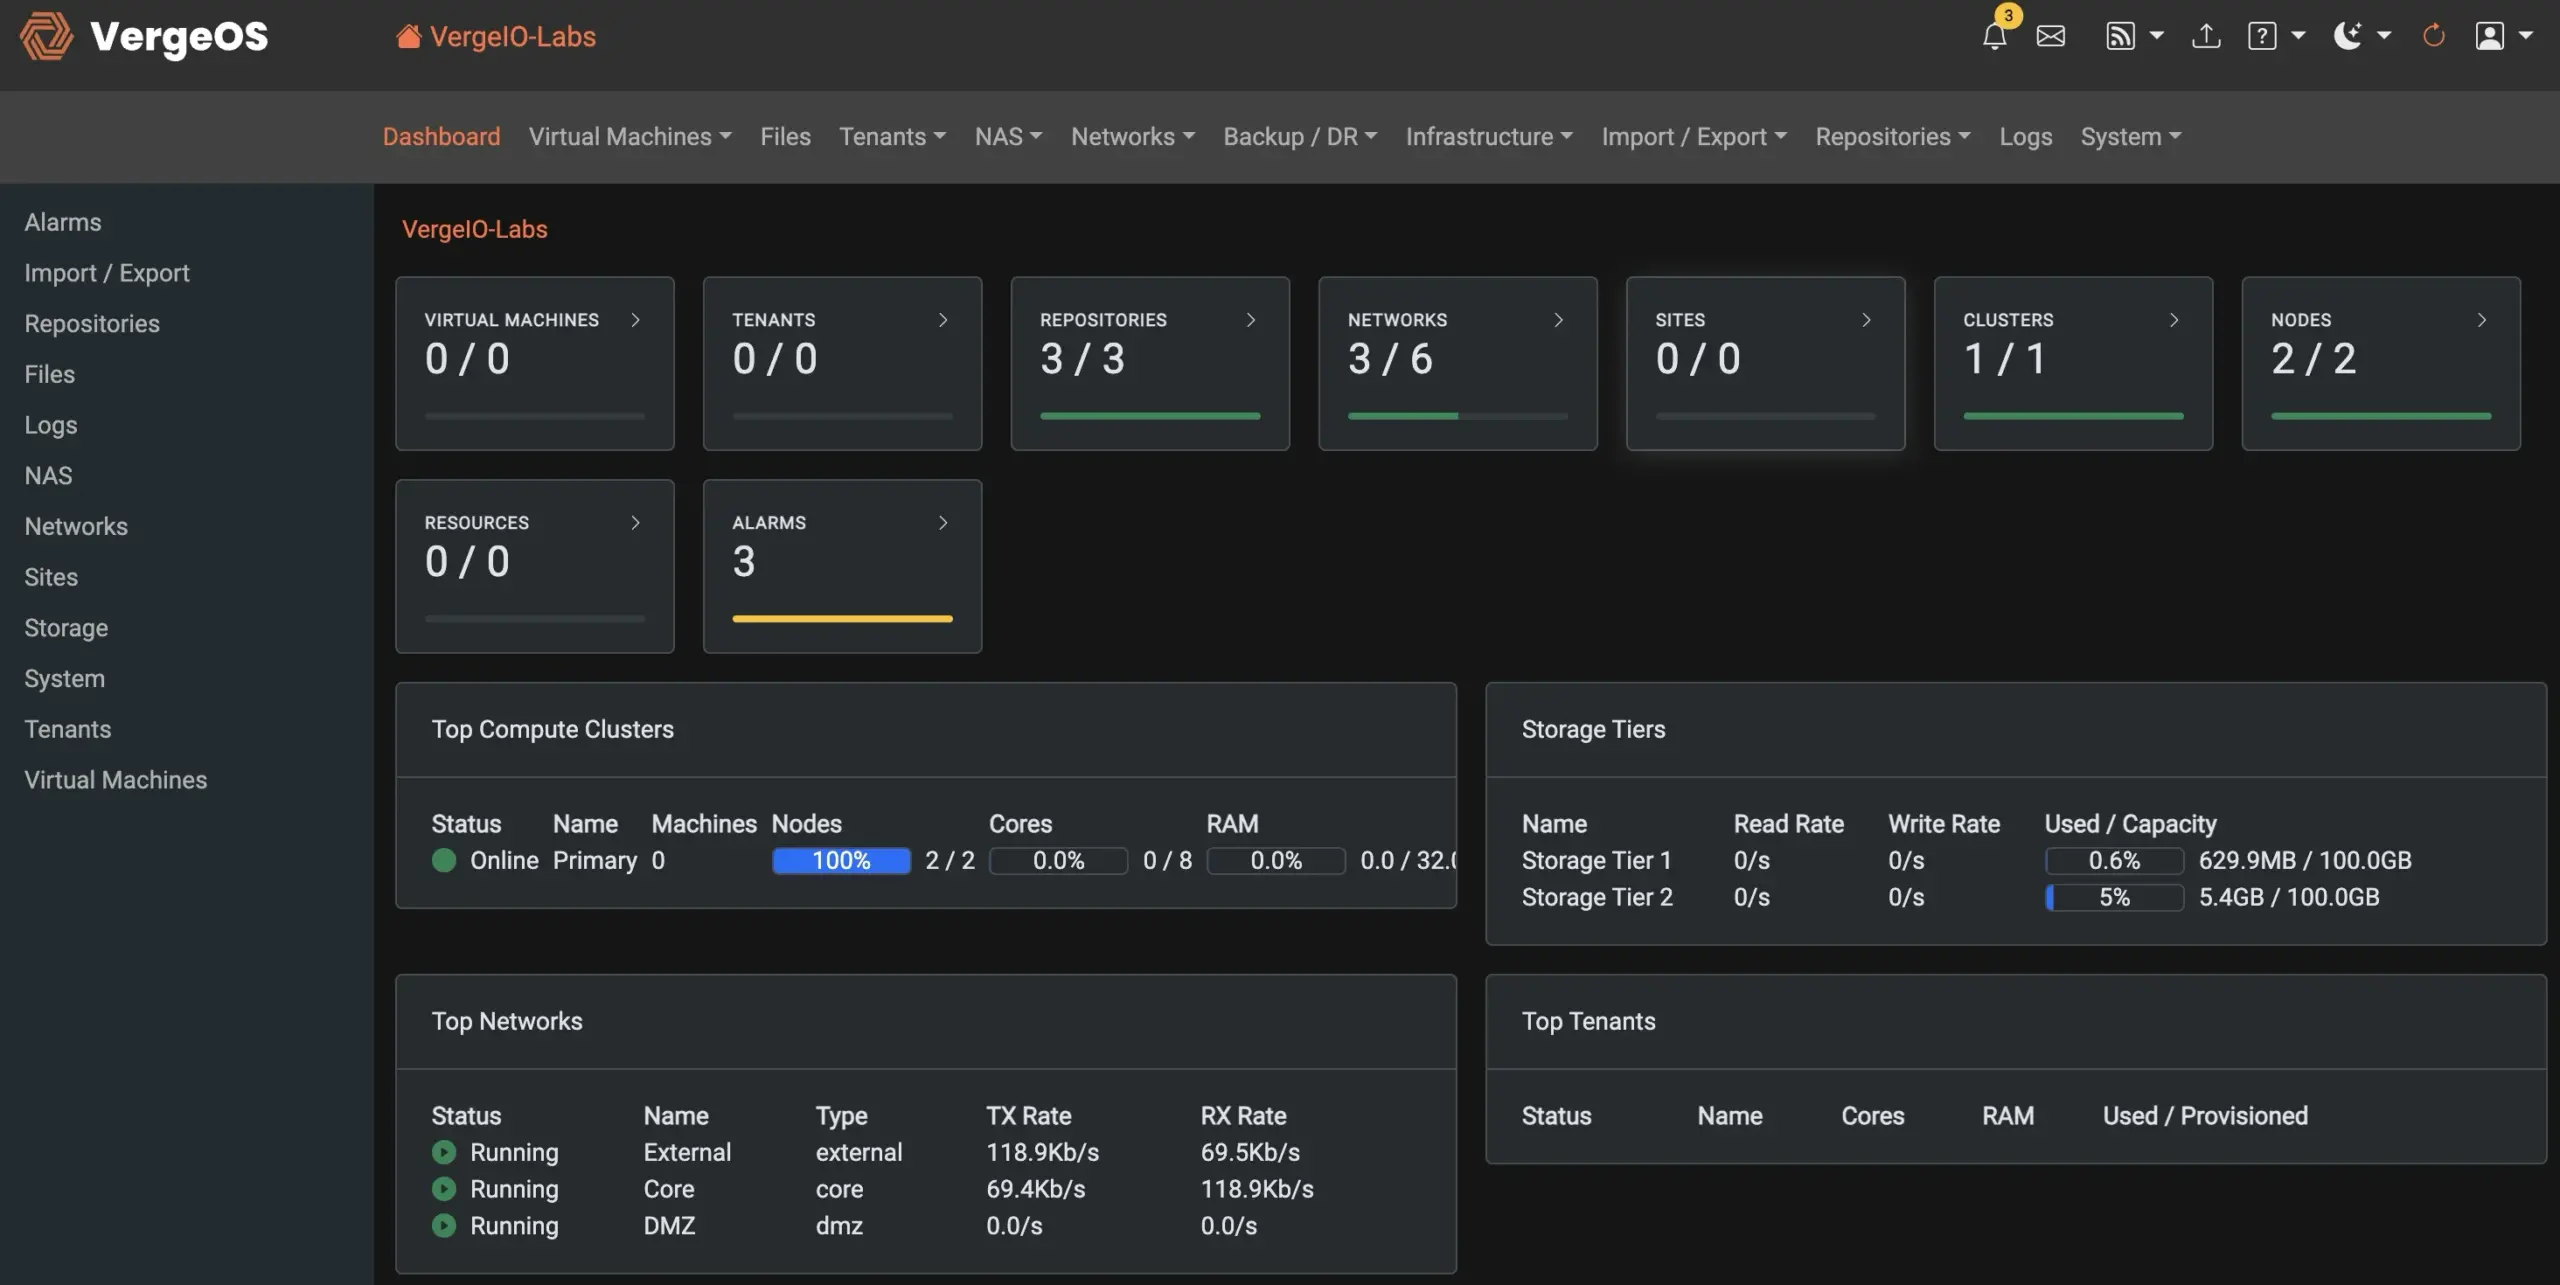
Step 3: Familiarize Yourself with the Interface
While we won’t spend much time on a full GUI tour, here’s what you should note for now:
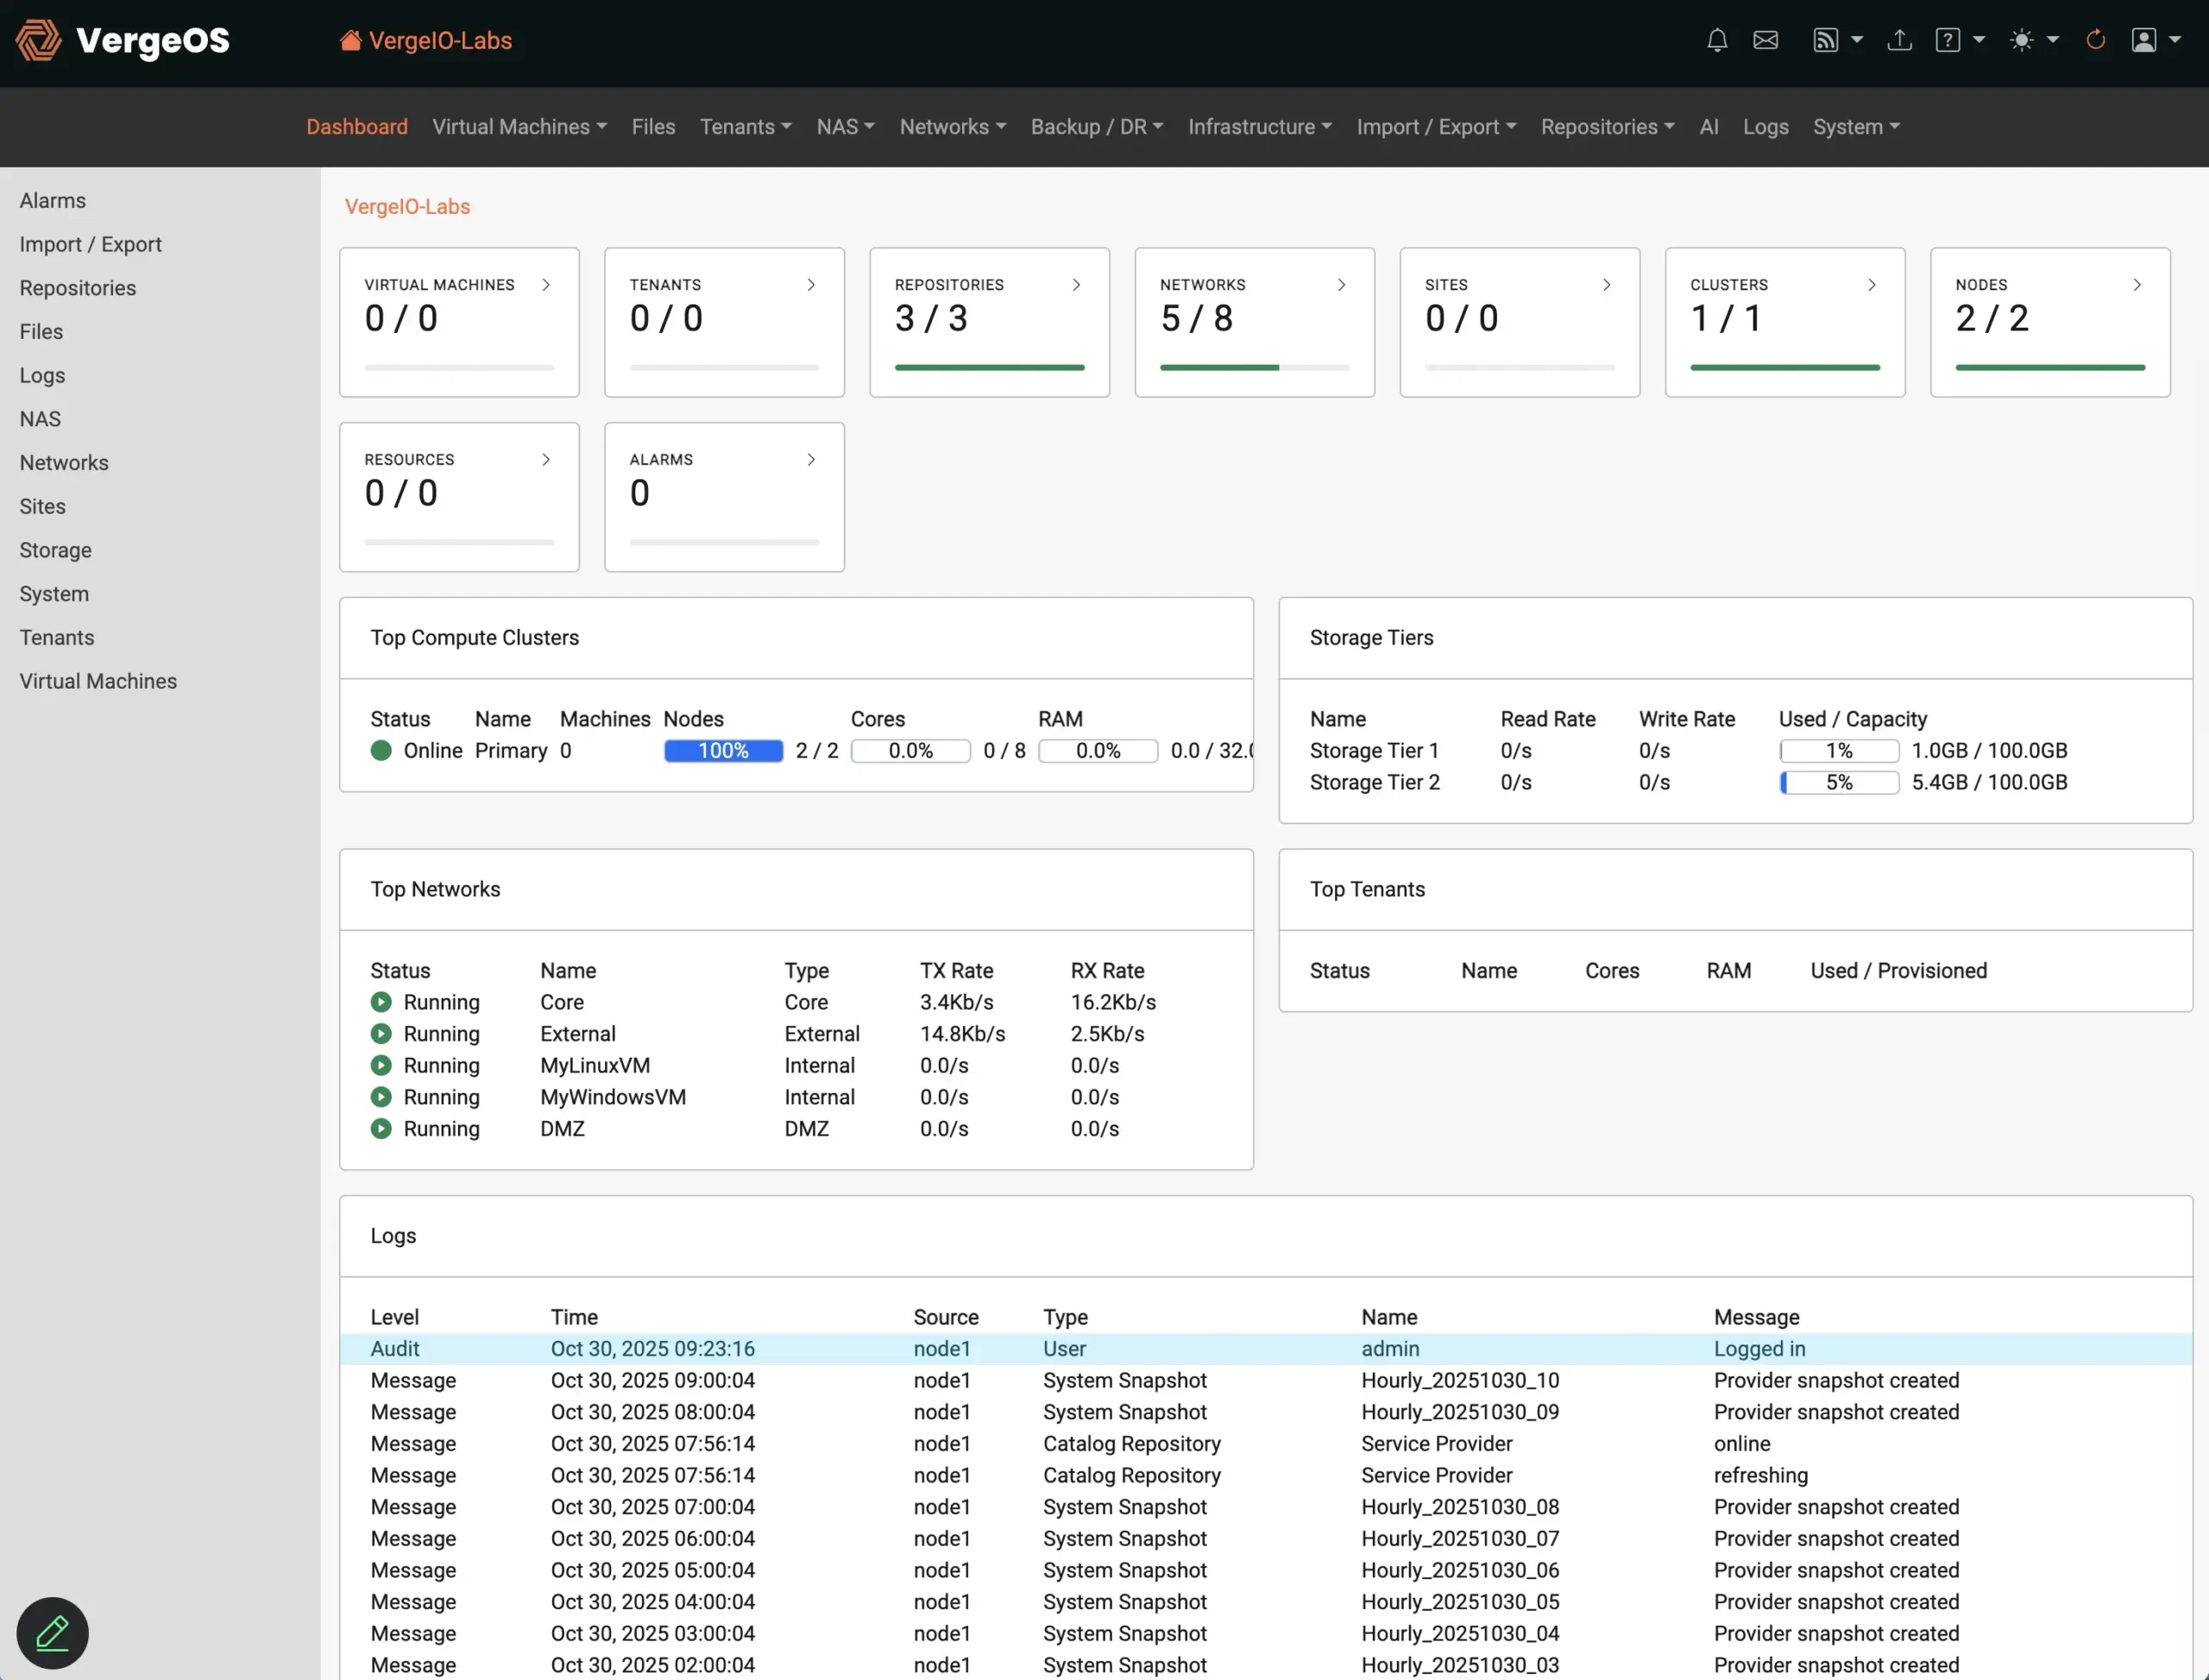
At the top of the screen, the main menu bar provides access to all VergeOS functional areas, including Virtual Machines, Files, Tenants, Networks, Backup/DR, Infrastructure, and System settings.
On the left is the context-sensitive sidebar, which changes dynamically based on the section you’re in—showing options relevant to that specific area, such as Drives, Snapshots, or Remote Console when working inside a virtual machine. This layout ensures that the controls and information you need are always close at hand, streamlining navigation and management across the entire VergeOS platform.

Top Menu Bar: Provides navigation across VergeOS.
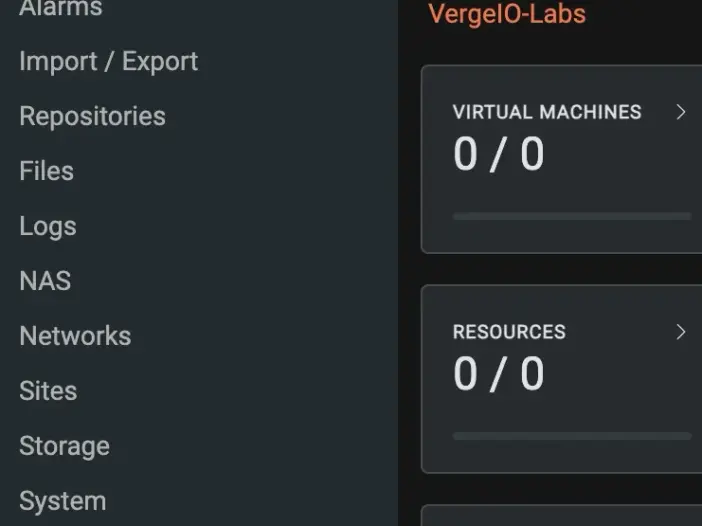
Left Context Menu: Changes dynamically depending on which component or service within VergeOS you are viewing.
✅ Checkpoint: You should see the top bar, context menu, and the main VergeOS dashboard clearly visible.
The main VergeOS Dashboard provides a comprehensive overview of the virtual environment, displaying key system metrics such as the number of Virtual Machines, Tenants, Repositories, Networks, Clusters, and Nodes at the top of the screen. Each tile shows both totals and usage indicators, giving you instant visibility into system capacity and health. The panels below display details for Top Compute Clusters, Top Networks, Storage Tiers, and Top Tenants, while the Logs section at the bottom tracks recent system and virtual machine activity in real time.

Part 2: Creating a Snapshot Policy
A snapshot policy defines protection schedules for your virtual machines. You’ll create one profile containing two periods: an hourly immutable snapshot and a daily quiesced snapshot.
A VergeOS snapshot is a point-in-time, space-efficient copy of a virtual machine or virtual data center that captures not only data but also its exact configuration—including compute, storage, and network state. Its primary purpose is to provide rapid recovery, instant cloning, and consistent protection across all workloads without relying on external backup software. Unlike traditional snapshots that are layered on top of a file system or depend on external storage arrays, VergeOS snapshots are built directly into the VergeFS global file system. This integration means they are instantaneous, immutable, and deduplicated globally, allowing thousands of snapshots to exist without performance impact and enabling recovery of an entire environment—not just individual VMs—in seconds.
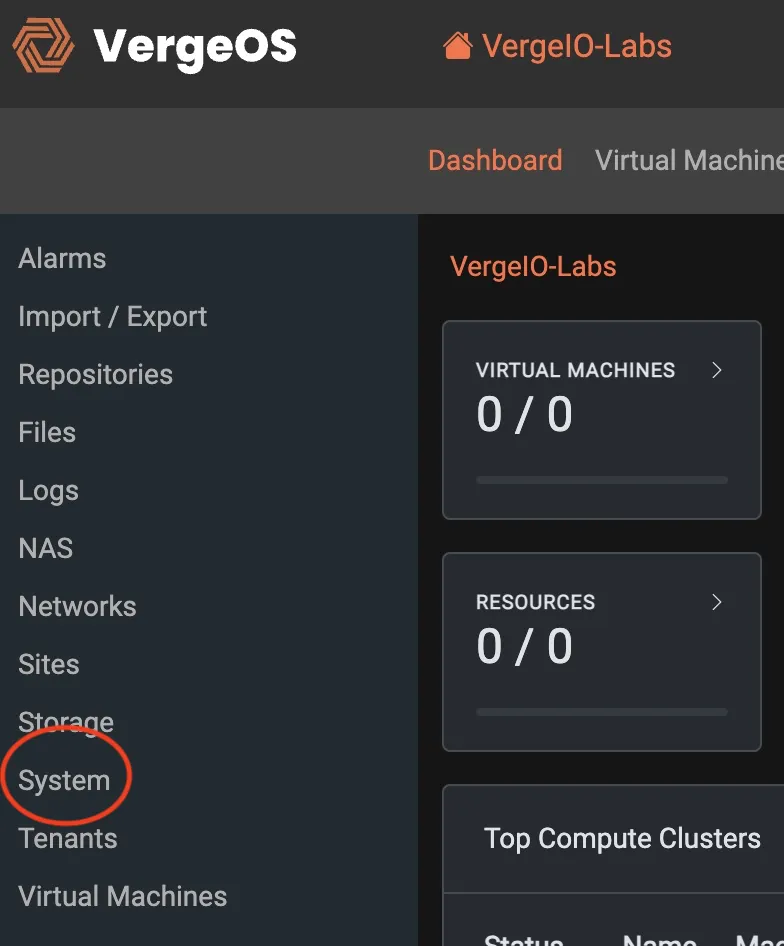
Select System to Reveal the Snapshot Profiles Option
A VergeOS snapshot is essentially a clone that leverages VergeOS’s global deduplication to deliver near-instant creation, rapid recovery, and exceptional space efficiency. Unlike traditional snapshot technologies that rely on a hierarchical metadata tree, VergeOS snapshots are fully independent objects within the VergeFS architecture. This design eliminates the cascading performance penalties that accumulate as snapshots age or multiply. Users can create and retain an unlimited number of snapshots indefinitely without performance degradation or storage bloat. Because each snapshot is self-contained, it can also be repurposed, cloned, or mounted even if the original virtual machine or dataset no longer exists—making it both a protection mechanism and a powerful operational tool.
Select Snapshot Profiles to Reveal the Snapshot Details Dashboard
Be careful not to select Subscription Profiles by accident
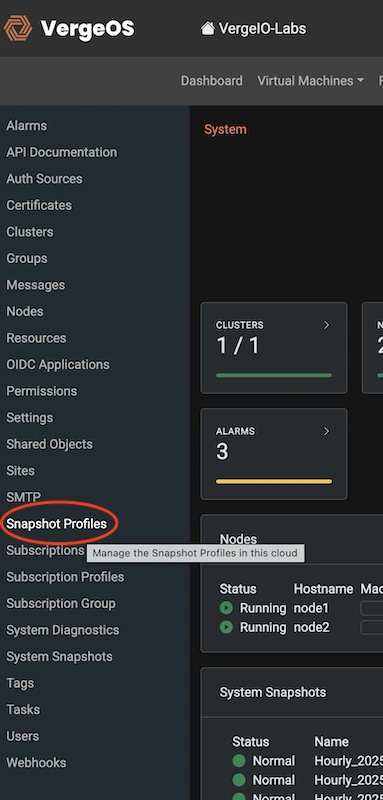
The Snapshot Profiles detail will appear in the main window.
A Snapshot Profile in VergeOS defines how and when data protection occurs for a specific object—whether that object is a System, Tenant, or Virtual Machine. When assigning a Snapshot Profile to an object, that object automatically follows the defined protection schedule, ensuring consistent and repeatable data protection without manual intervention. VergeOS provides several example profiles to help you get started, but for the purposes of this lab we will create a custom profile.
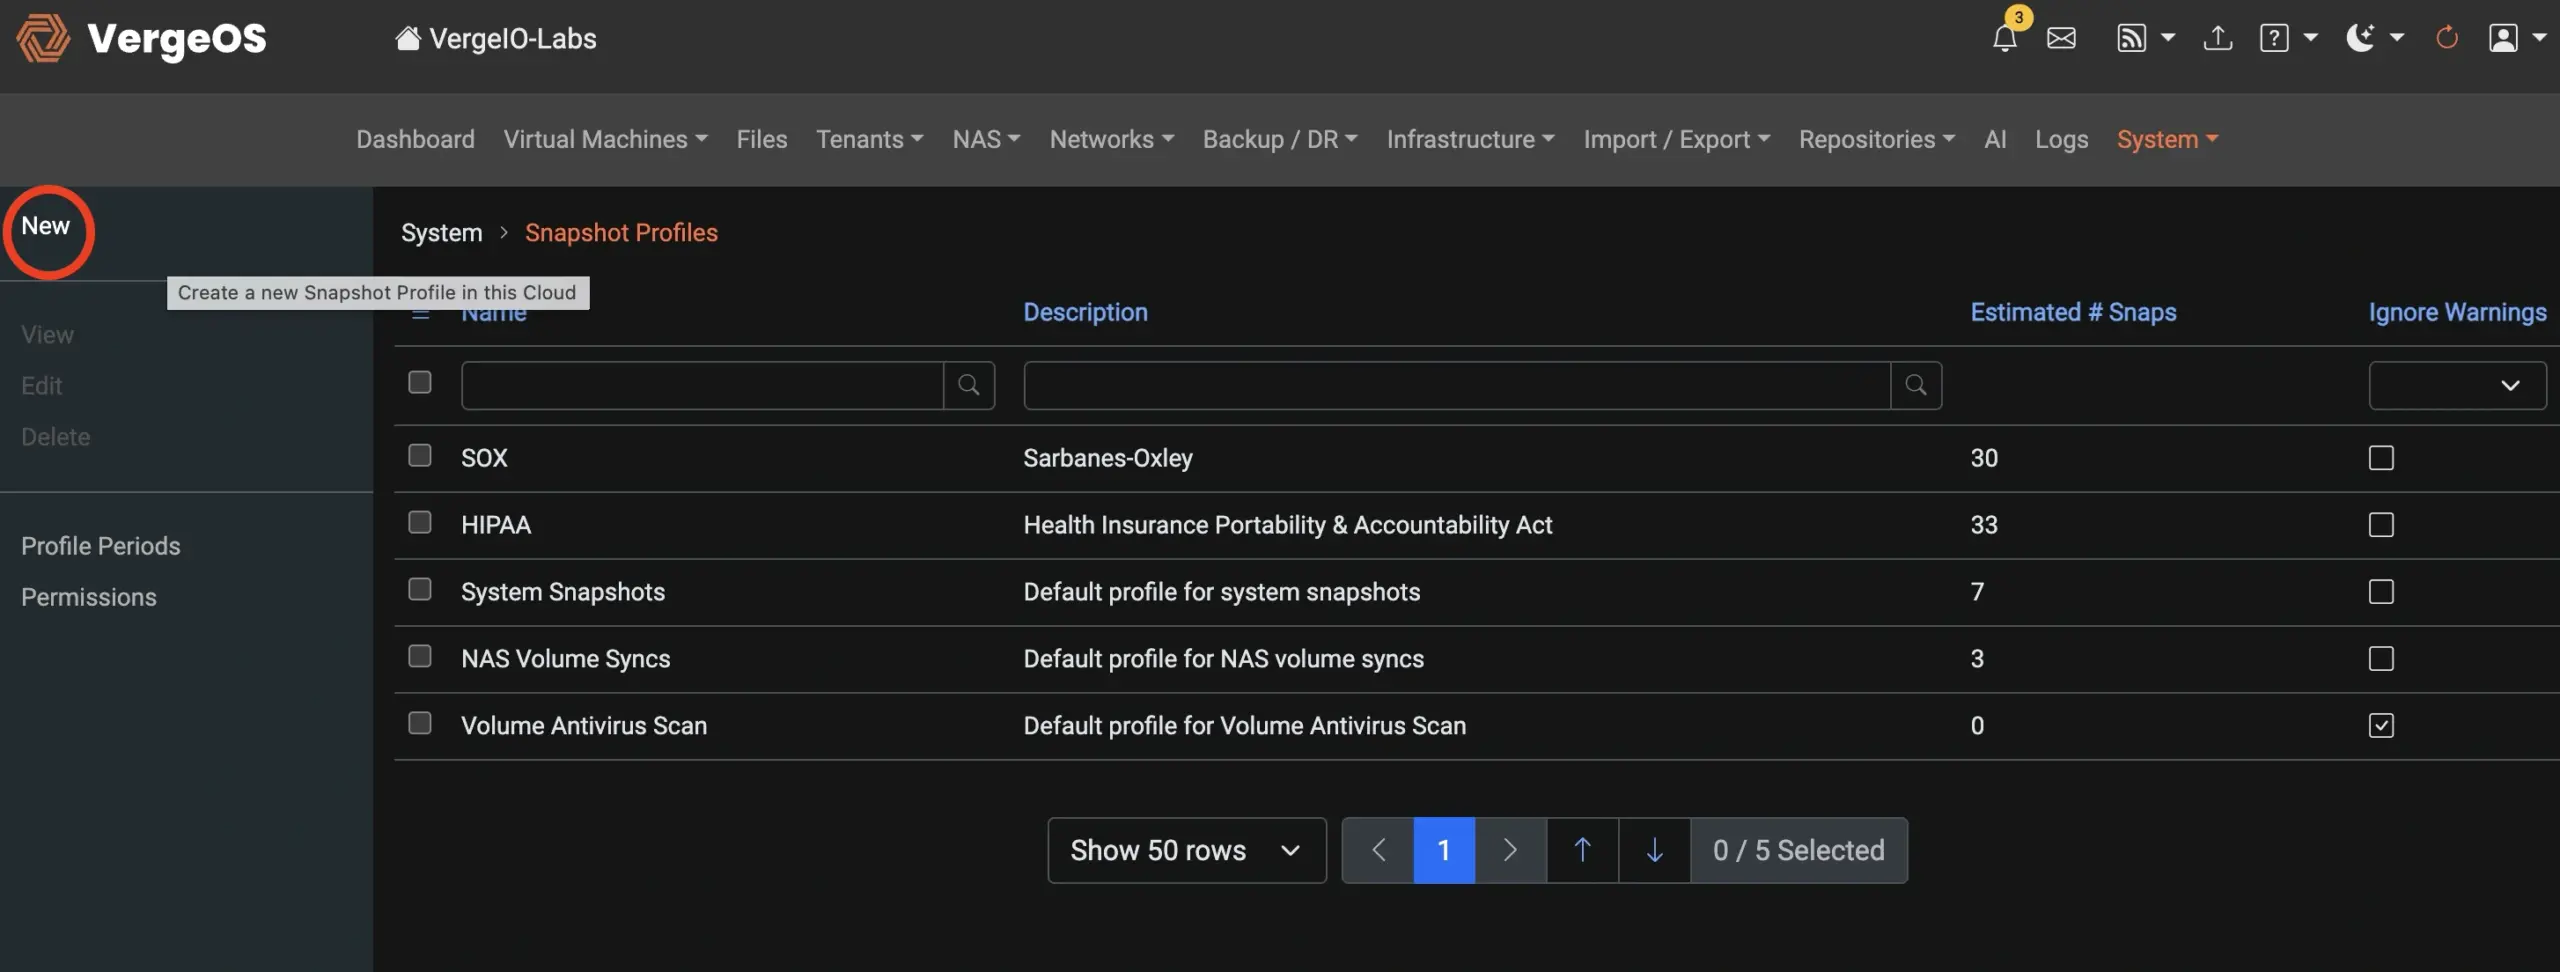
Select New from the left context menu to create a new snapshot profile
In the Create Snapshot Profile window, configure these settings:
Name:
MySnapProfile
Description:
Snapshot profile for hands-on lab (optional)
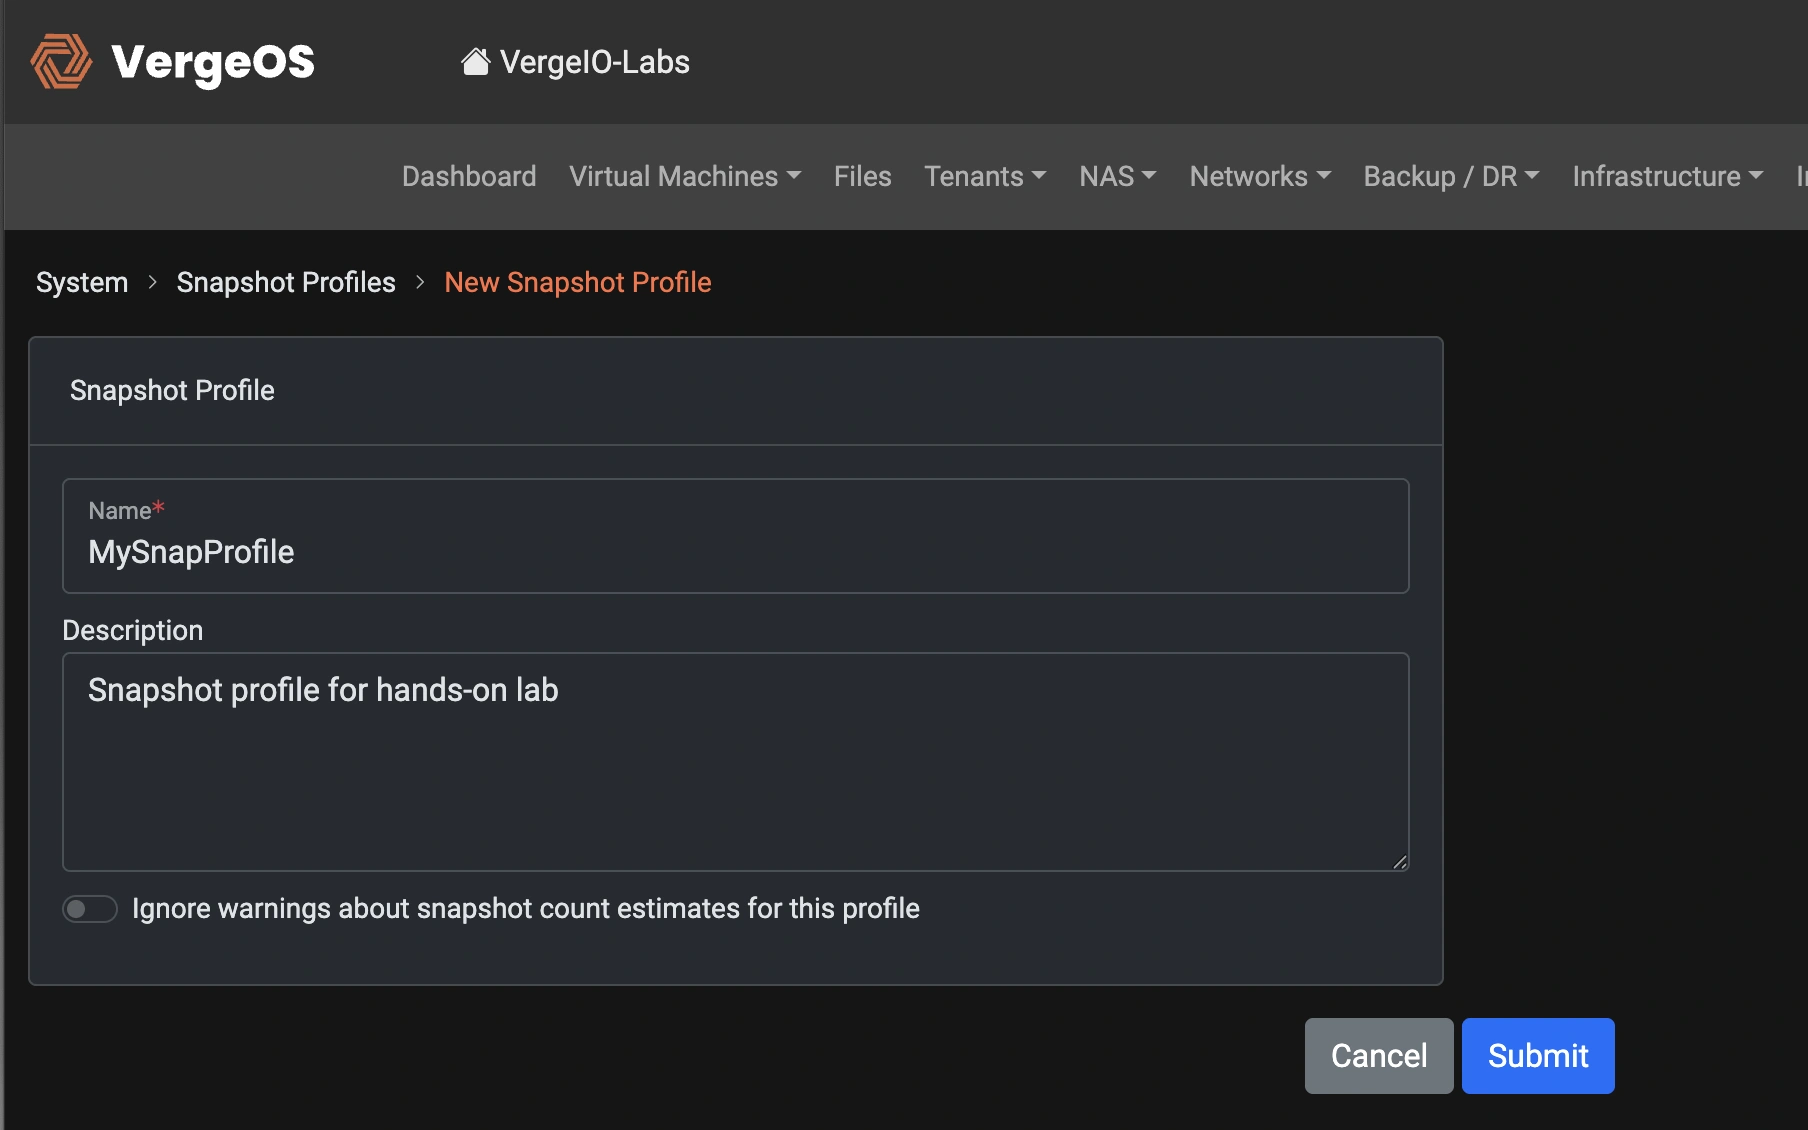
Click Submit.
✅ Checkpoint: You should now see my snapshot profile listed under Snapshot Profiles.

Adding a Period to Your Snapshot Profile
Periods are the individual schedule definitions within a Snapshot Profile that determine when and how often VergeOS snapshots are taken. Each period specifies parameters such as the interval (hourly, daily, weekly), retention duration, and snapshot type—whether immutable for protection against ransomware or quiesced for application-consistent recovery. By combining multiple periods within a single Snapshot Profile, administrators can layer protection strategies to meet different recovery point and retention objectives.

Select "MySnapProfile" and Click View in the Left Context Menu
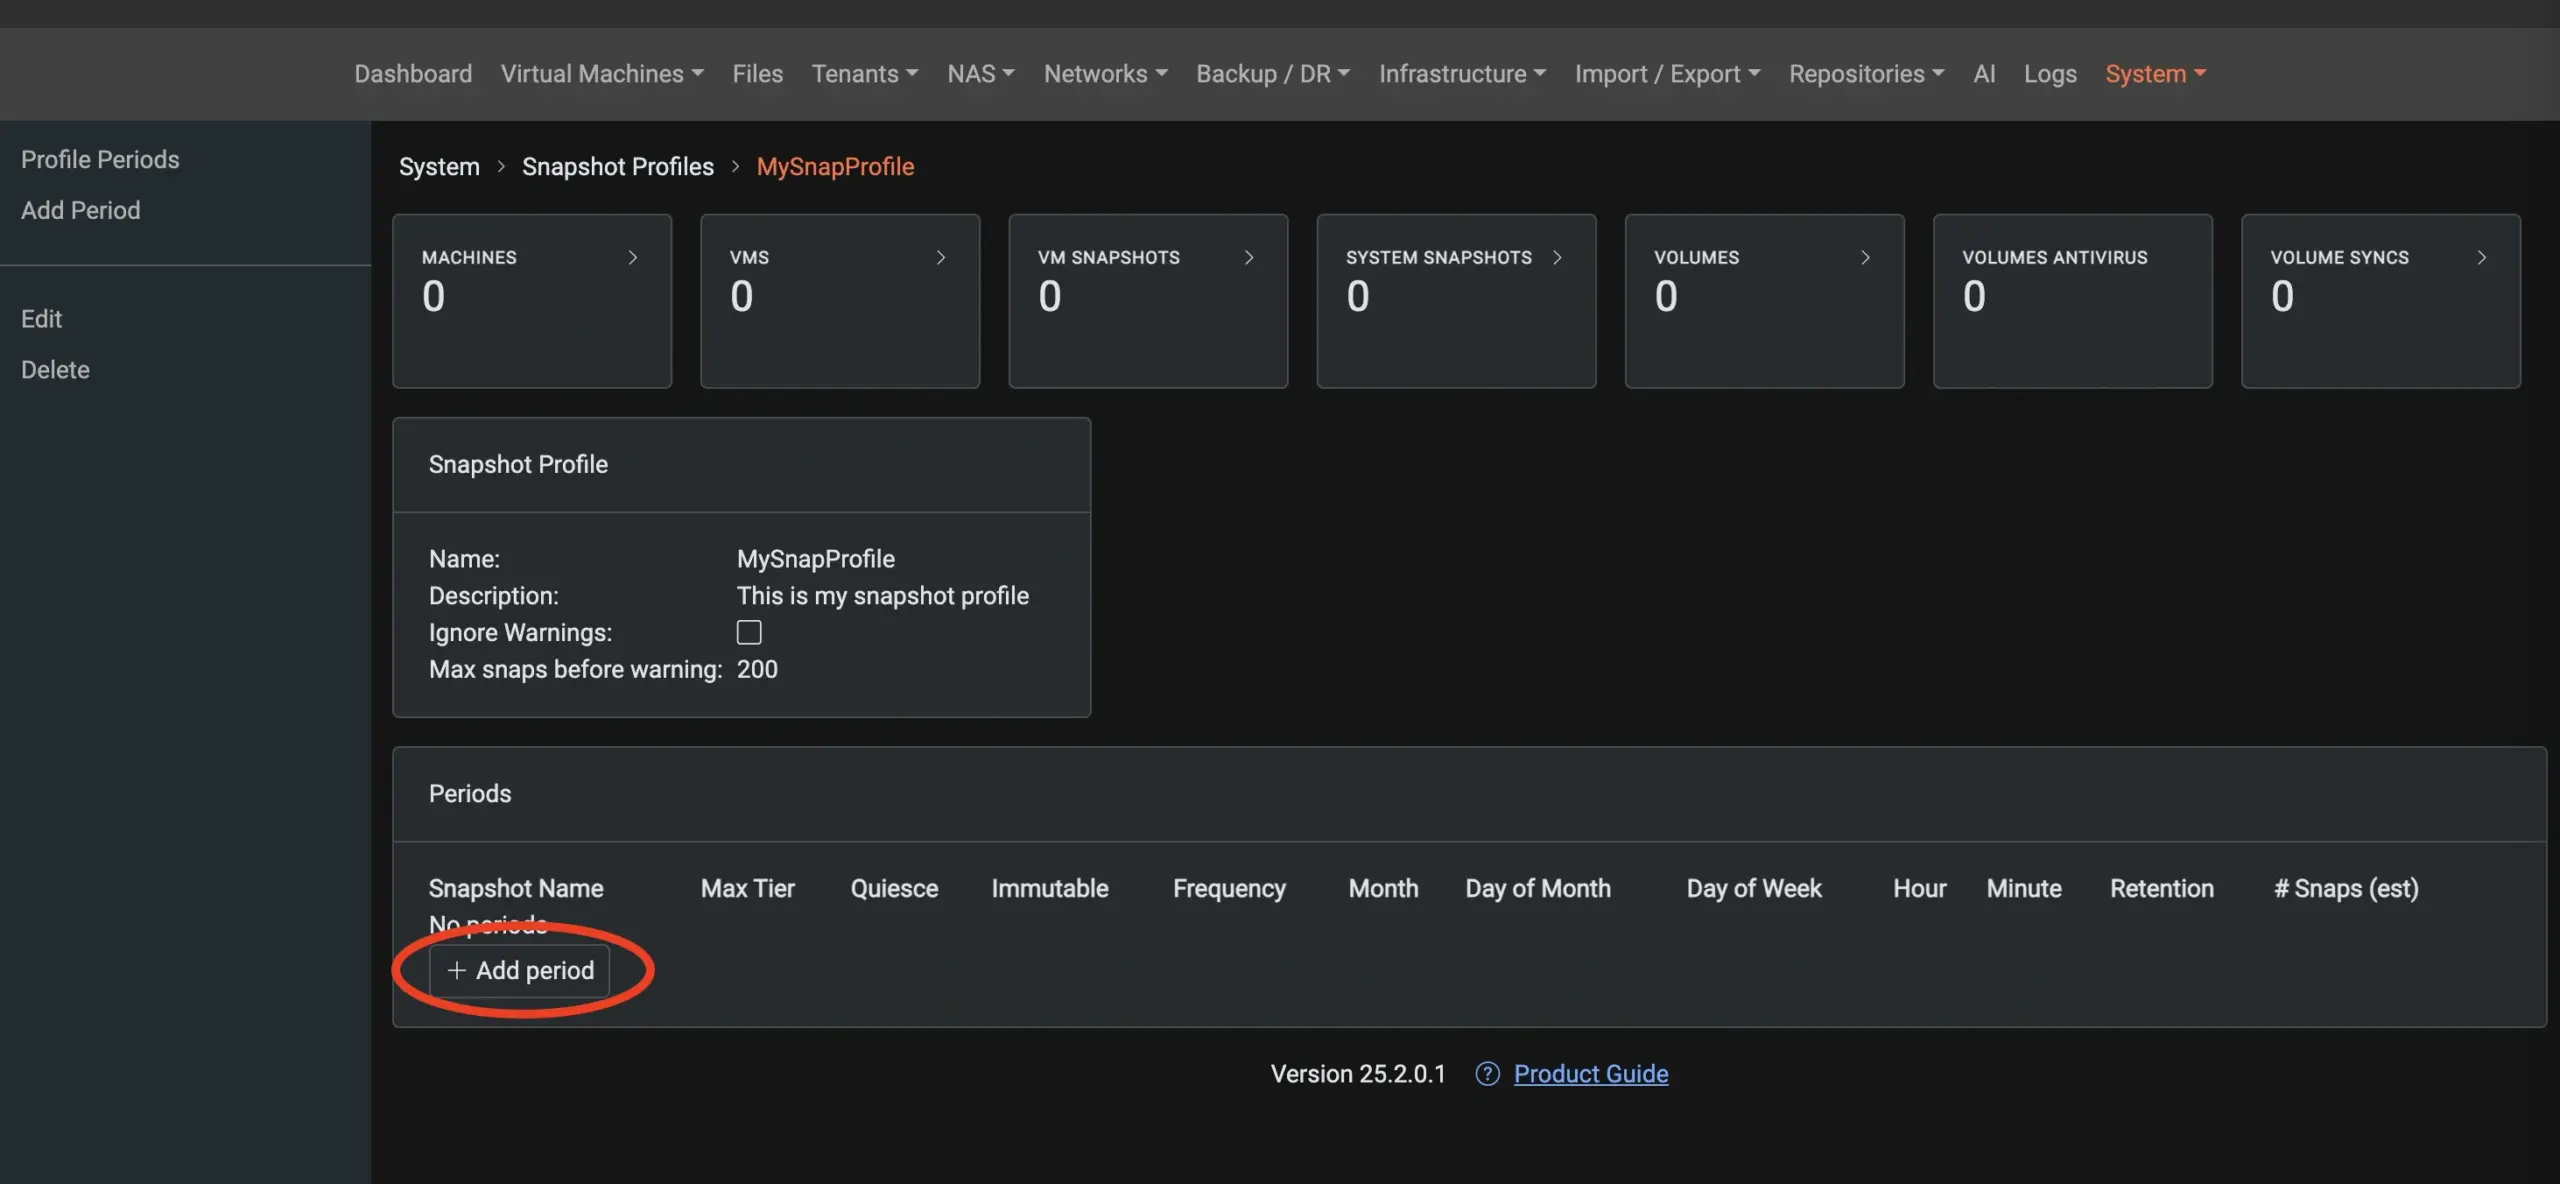
Select the Add Period button.
Add an Hourly Protection Period
1. In the Add Period form, configure:
• Period Name: hourly protection
• Immutable: Toggle ON
⚠️ Alert: Immutable snapshots cannot be manually deleted—they’re only removed automatically by the retention policy.
• Frequency: Hourly
• Snapshot Time: Set for 15 minutes from now
• Retention: 3 hours
• Minimum Snapshots Retained: 2
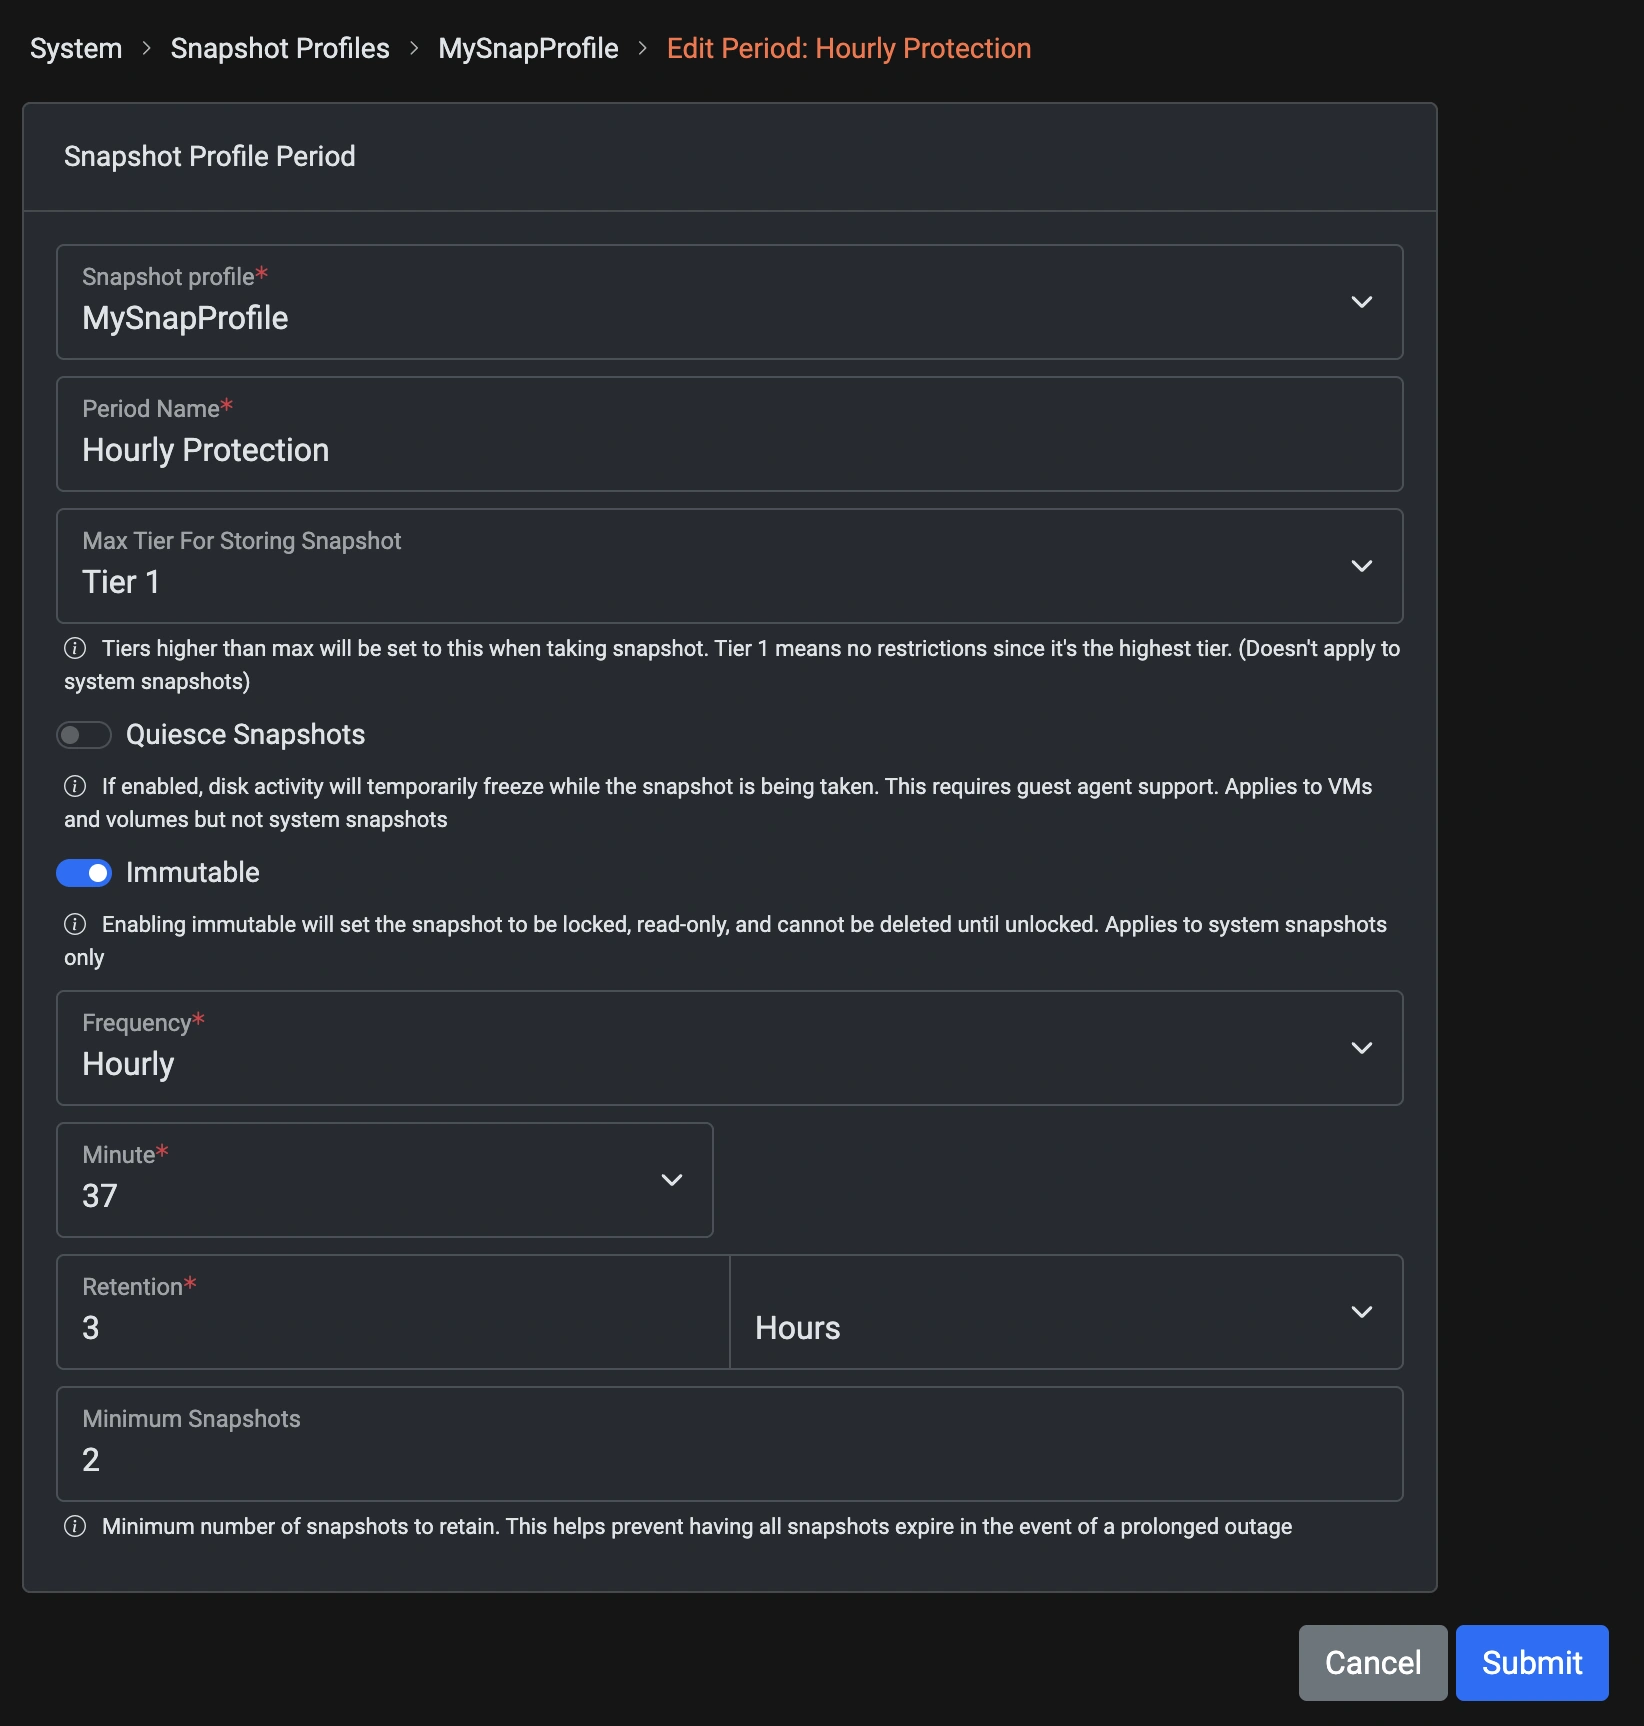
Click the Submit button to return to the Snapshot Profile's detail screen
Add a Daily Protection Period
Click Add Period again under the same profile.
Configure:
• Period Name: daily snapshot
• Immutable: Leave OFF
• Quiesce: Toggle ON (for application-consistent snapshots)
• Frequency: Daily
• Time: 12:00 PM
• Retention: 7 days
• Minimum Snapshots Retained: 5
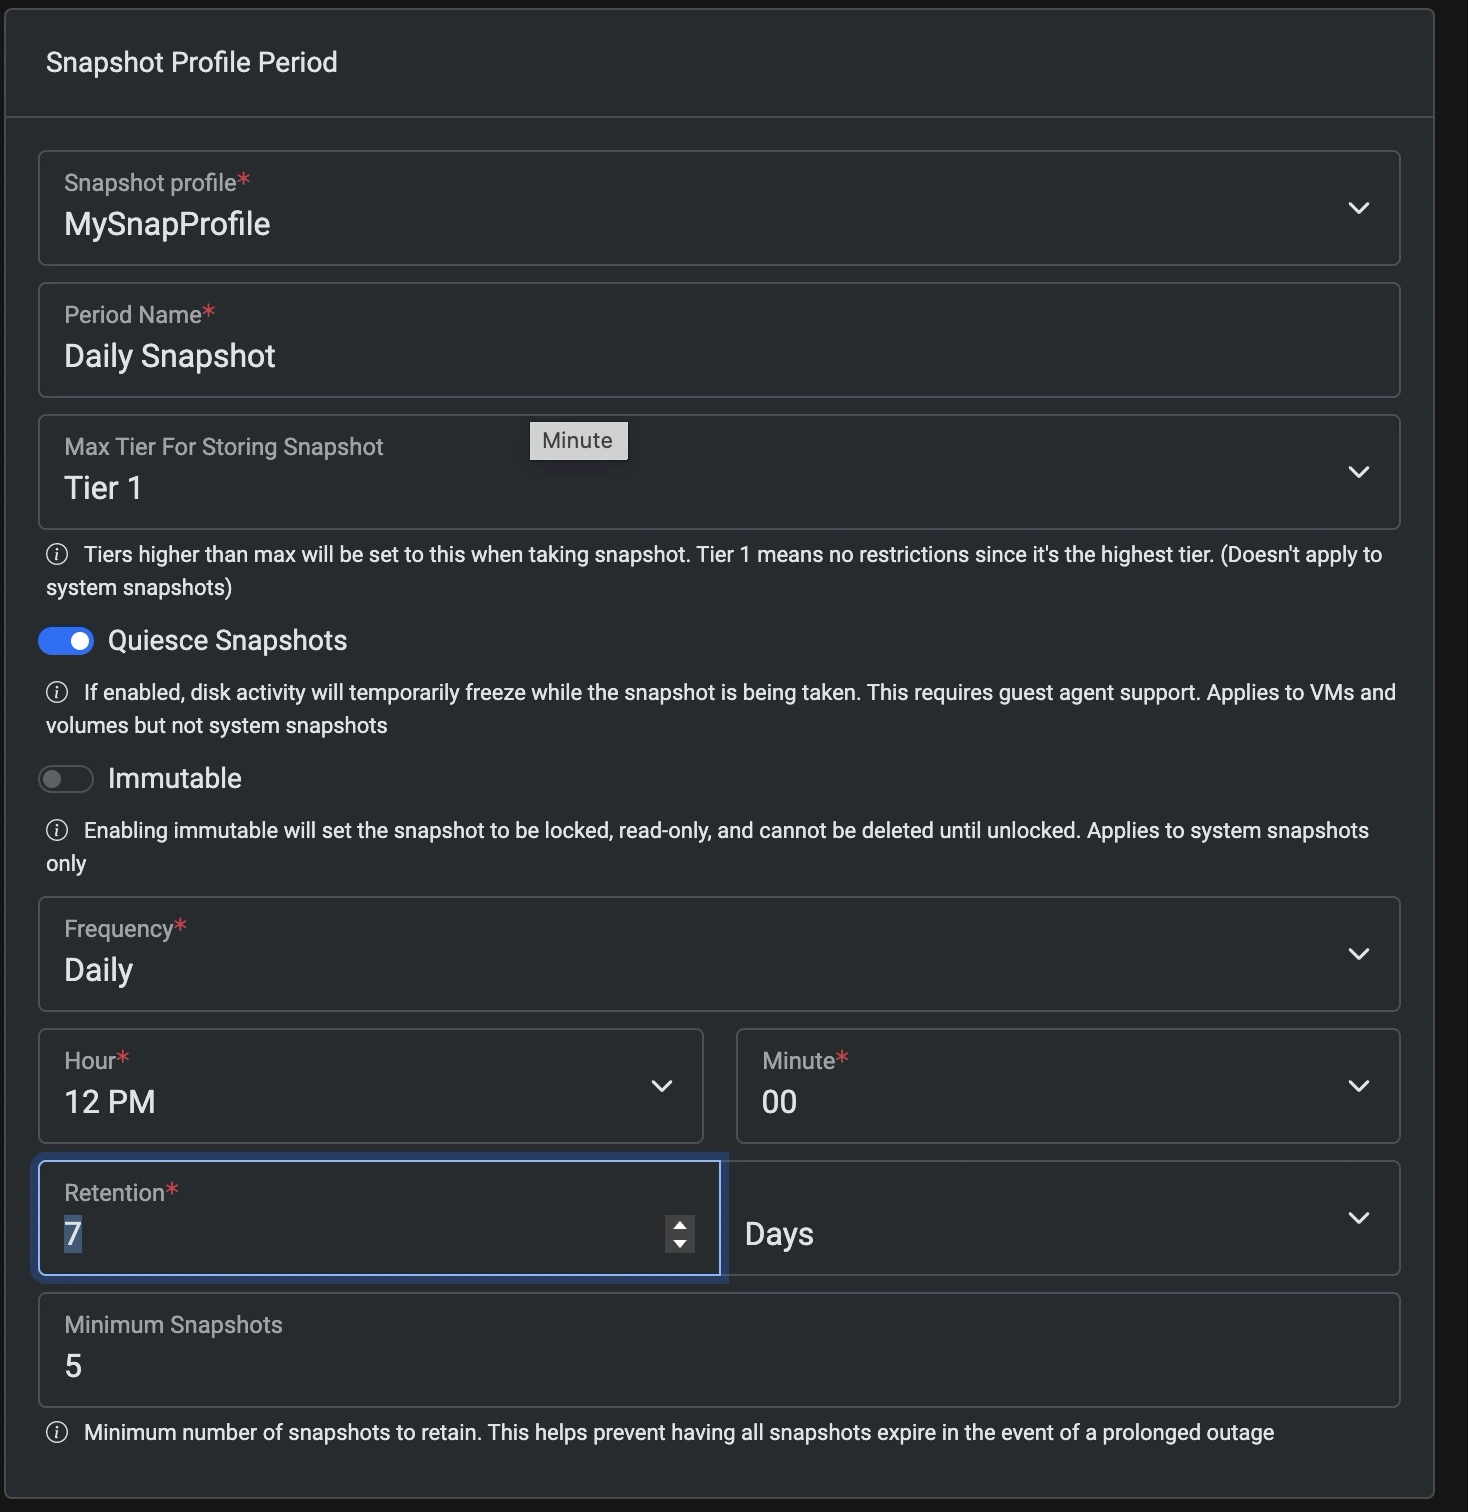
Click the Submit Button to return to the overview of the MySnapProfile Snapshot Profile.
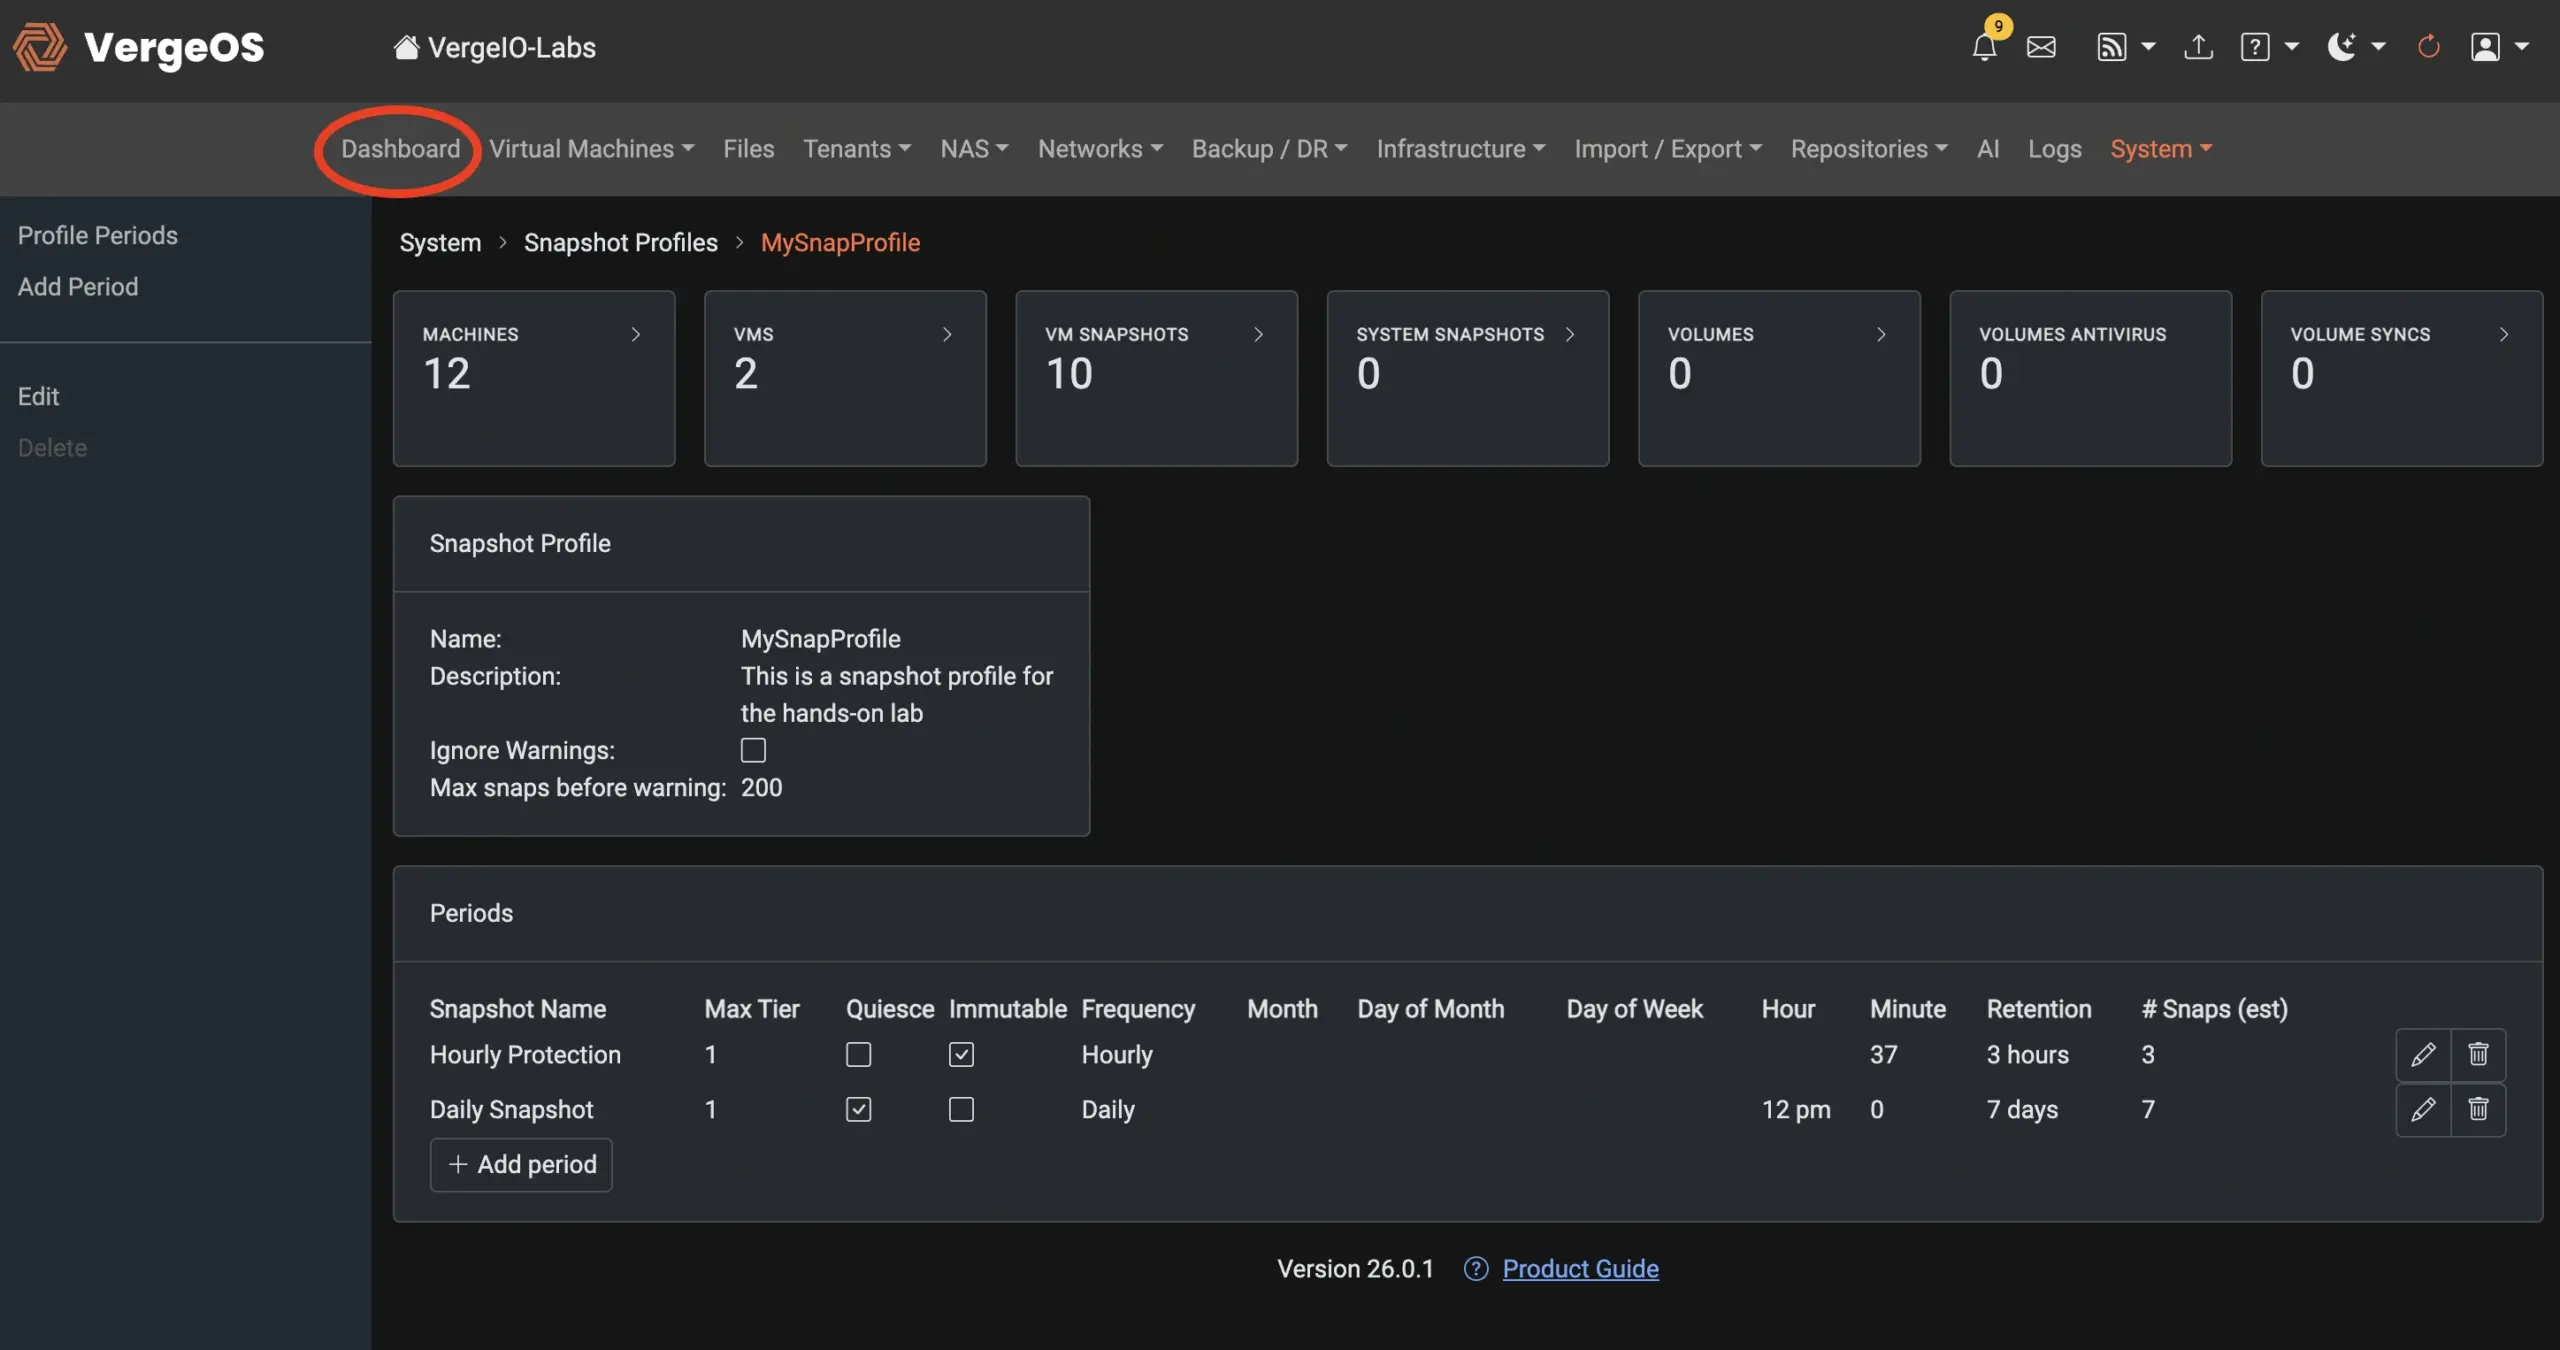
✅ Checkpoint:
- Both hourly protection and daily snapshot should now appear under your snapshot profile.
- Click on the "Dashboard" Menu Item to return to the main Dashboard.
Part 3: Creating Tag Categories and Tags
One of the most powerful capabilities in VergeOS 26 is the ability to tag almost any resource across the infrastructure — from VMs and storage volumes to networks, nodes, and even Virtual Data Centers (VDCs). Tagging transforms management from manual configuration into automated policy enforcement. Instead of managing each object individually, administrators can apply tags that define behavior — such as backup frequency, replication targets, security policies, or performance tiers — and VergeOS automatically enforces those rules system-wide. This approach brings consistency, scalability, and clarity to complex environments, enabling the management of thousands of workloads with the same precision as a handful. In short, tagging in VergeOS turns infrastructure management into intent-based automation.

Select System from the left context menu
This will reveal the Tags Categories display in the primary window
In VergeOS, tag categories and tags work together to bring structure and intent to infrastructure organization and automation. The distinction exists to make tagging both powerful and predictable.
Categories define the type or purpose of a tag — for example, “Production VMs,” “Lab VMs,” “Performance Tier,” or “Compliance.” Each category groups related tags, ensuring consistency and preventing conflicts.
Within each category, tags represent specific values or policies — for example, under “Environment,” tags might include Production, Development, or Test. Under “Protection Policy,” tags might include Gold, Silver, and Bronze, each tied to distinct snapshot and replication settings.
Then select Tags from the Left Context Menu
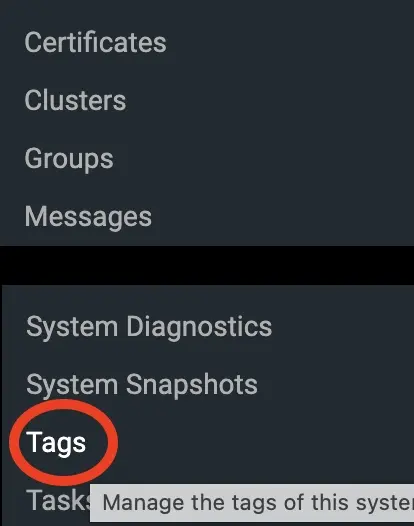

To create a new category select New from the left-hand context menu
Clicking "New" opens the New Tag Category window. We are going to create a category for VMs we will use as part of the hands-on labs.
Name Field: Lab VMs
Description: These are VMs that are a part of the hands-on lab
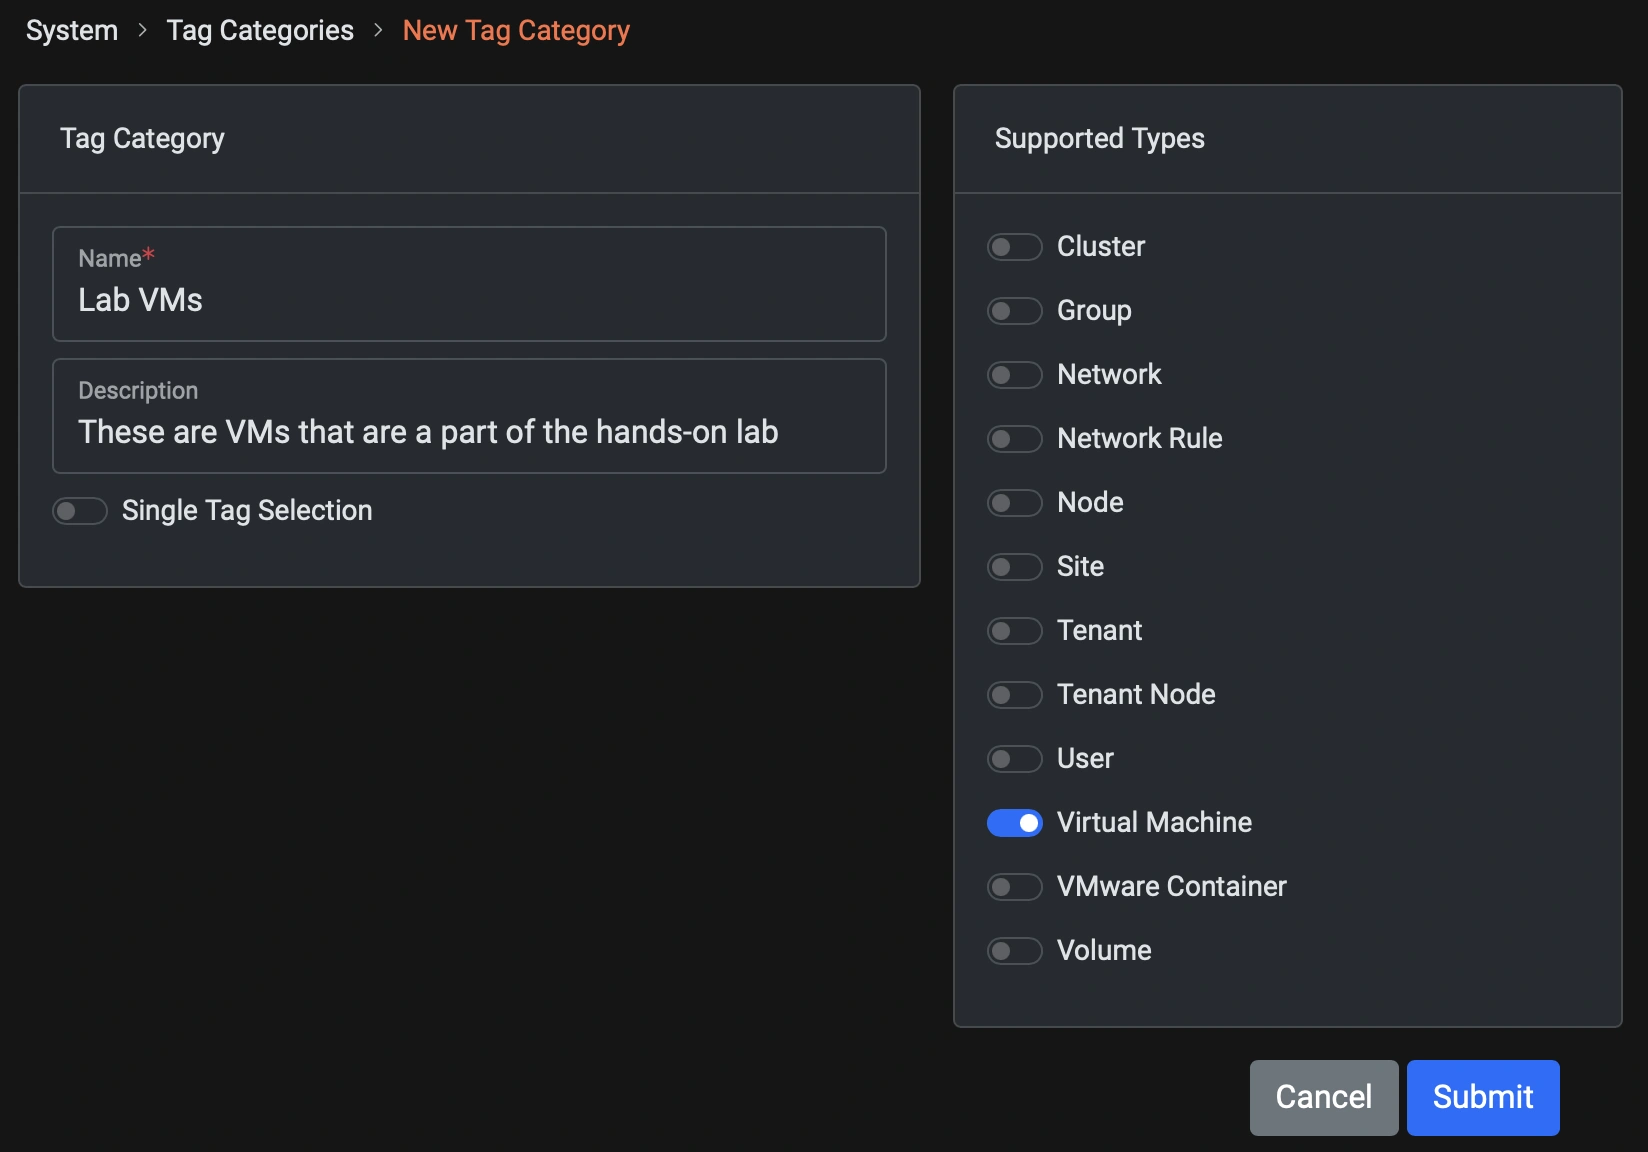
Click: Submit
After clicking submit, you are returned to the tag categories screen.
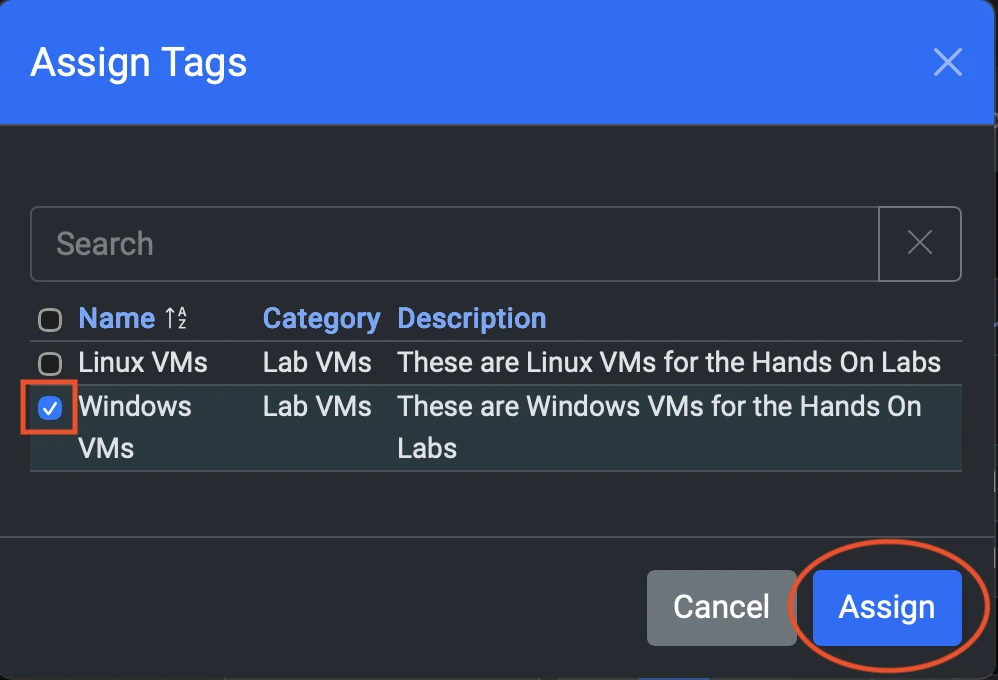
Next, we will create tags for the VMs in that category. As part of this lab, we will create two virtual machines—one Windows and one Linux—and assign a tag to each.
Now you will see the tags associated with this category. At this point, there are none.

Click the New button on the left-hand context menu to create a new tag
This tag will be used to organize our Windows VMs. Fill in the fields as below:
Name: Windows VMs
Description: These are Windows VMs for the Hands On Labs

Click: Submit
You are now returned to the Lab VMs tag category screen, and you should see the Windows VM tag in the center pane.
Now we will create a tag for our Linux VMs that we will make in the lab.

From the left context pane, select New.
As with the Windows VM tag, fill out the form:
Name: Linux VMs
Description: These are the Linux VMs for the Hands On Labs
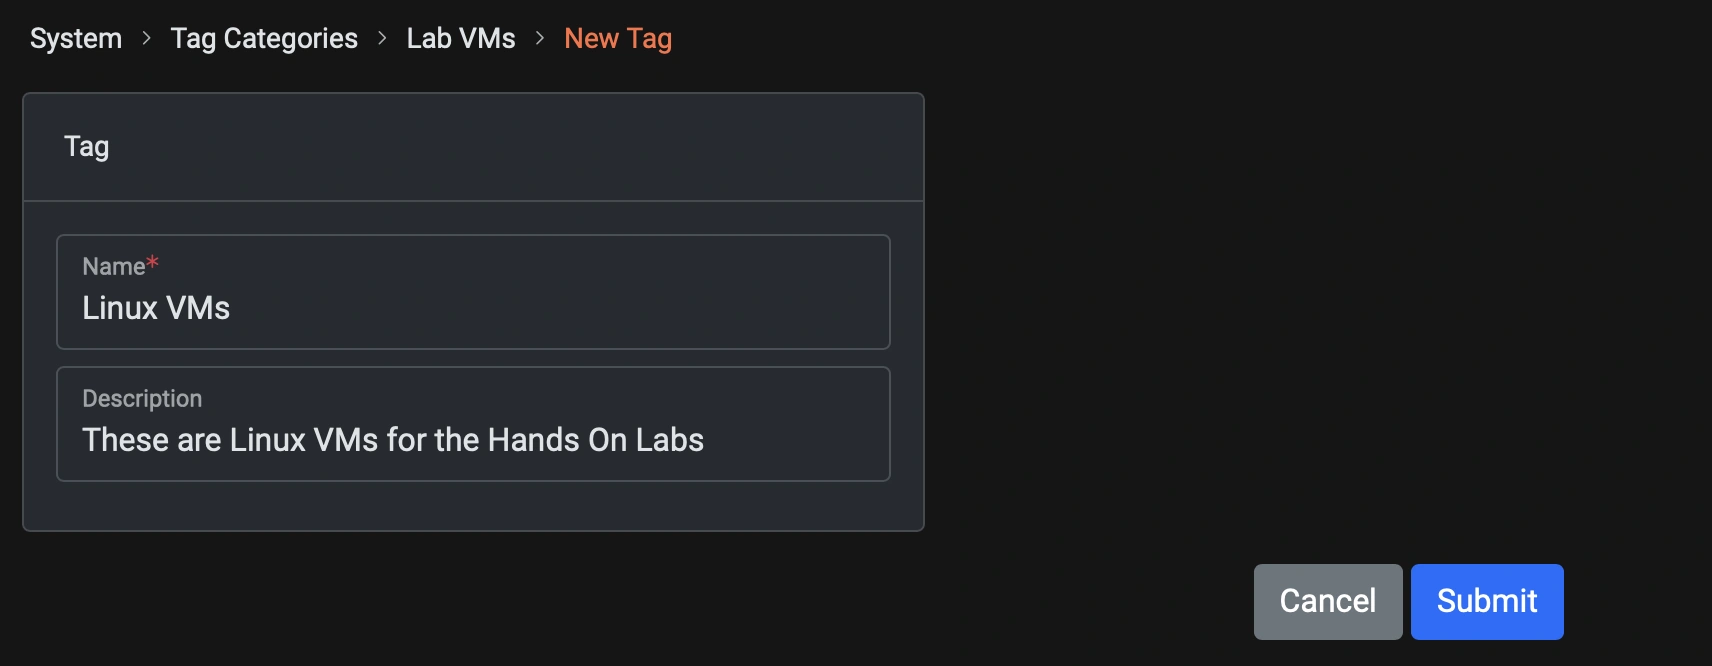
Click: Submit
✅ Checkpoint:
You should now see the two tags you created under the Lab VMs category.

Part 4: Creating Virtual Machines
The next step in the lab is to create virtual machines. You’ll begin by creating a Windows virtual machine, followed by a Linux virtual machine. Once each VM is created, you’ll apply the Snapshot Profile to automate its protection schedule and assign tags to organize and identify it within the VergeOS environment. This step demonstrates how VergeOS simplifies policy-based management, ensuring that each virtual machine inherits the correct protection settings and can be easily tracked or grouped for future operations.
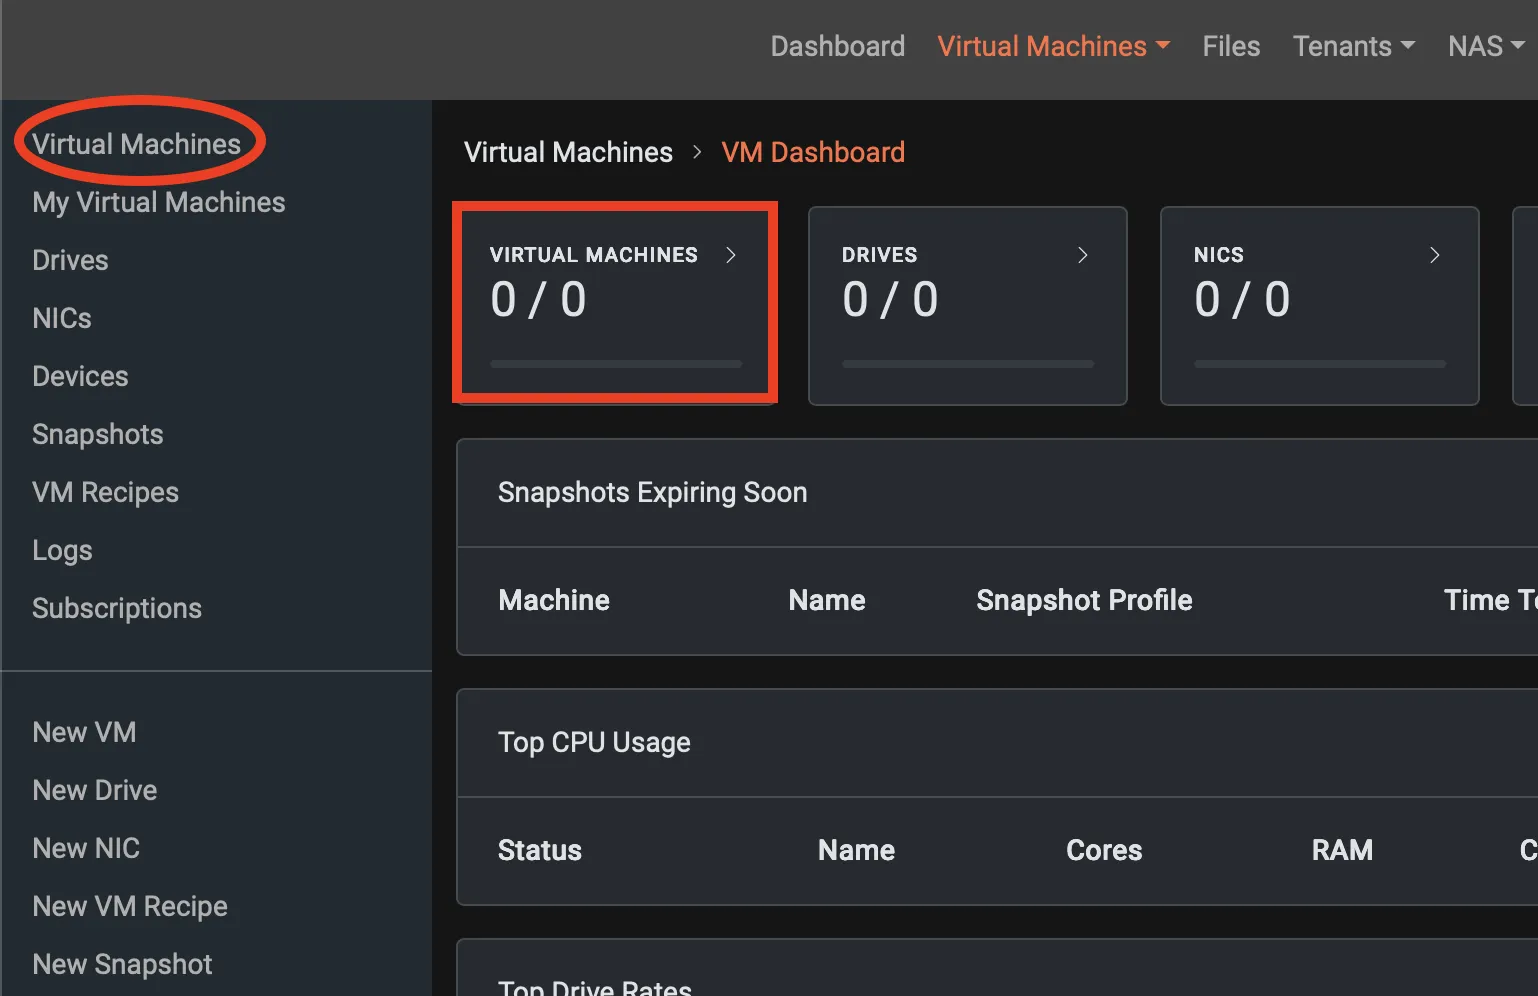
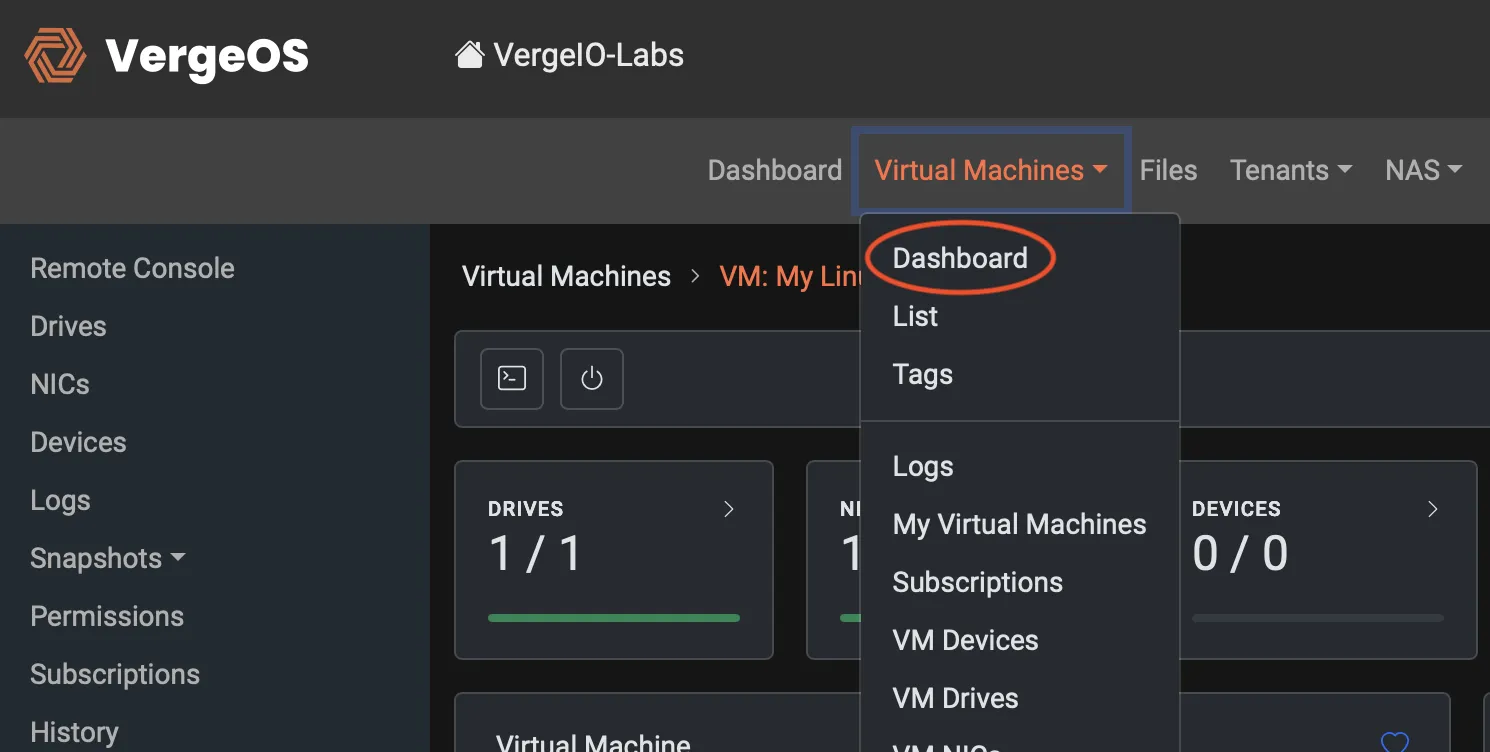
To return to the main VergeOS dashboard, click “Dashboard” from the top navigation bar. When the Dashboard appears, navigate to the Virtual Machines dashboard either by clicking on the Virtual Machines card or selecting the Virtual Machines top menu bar and selecting Dashboard.

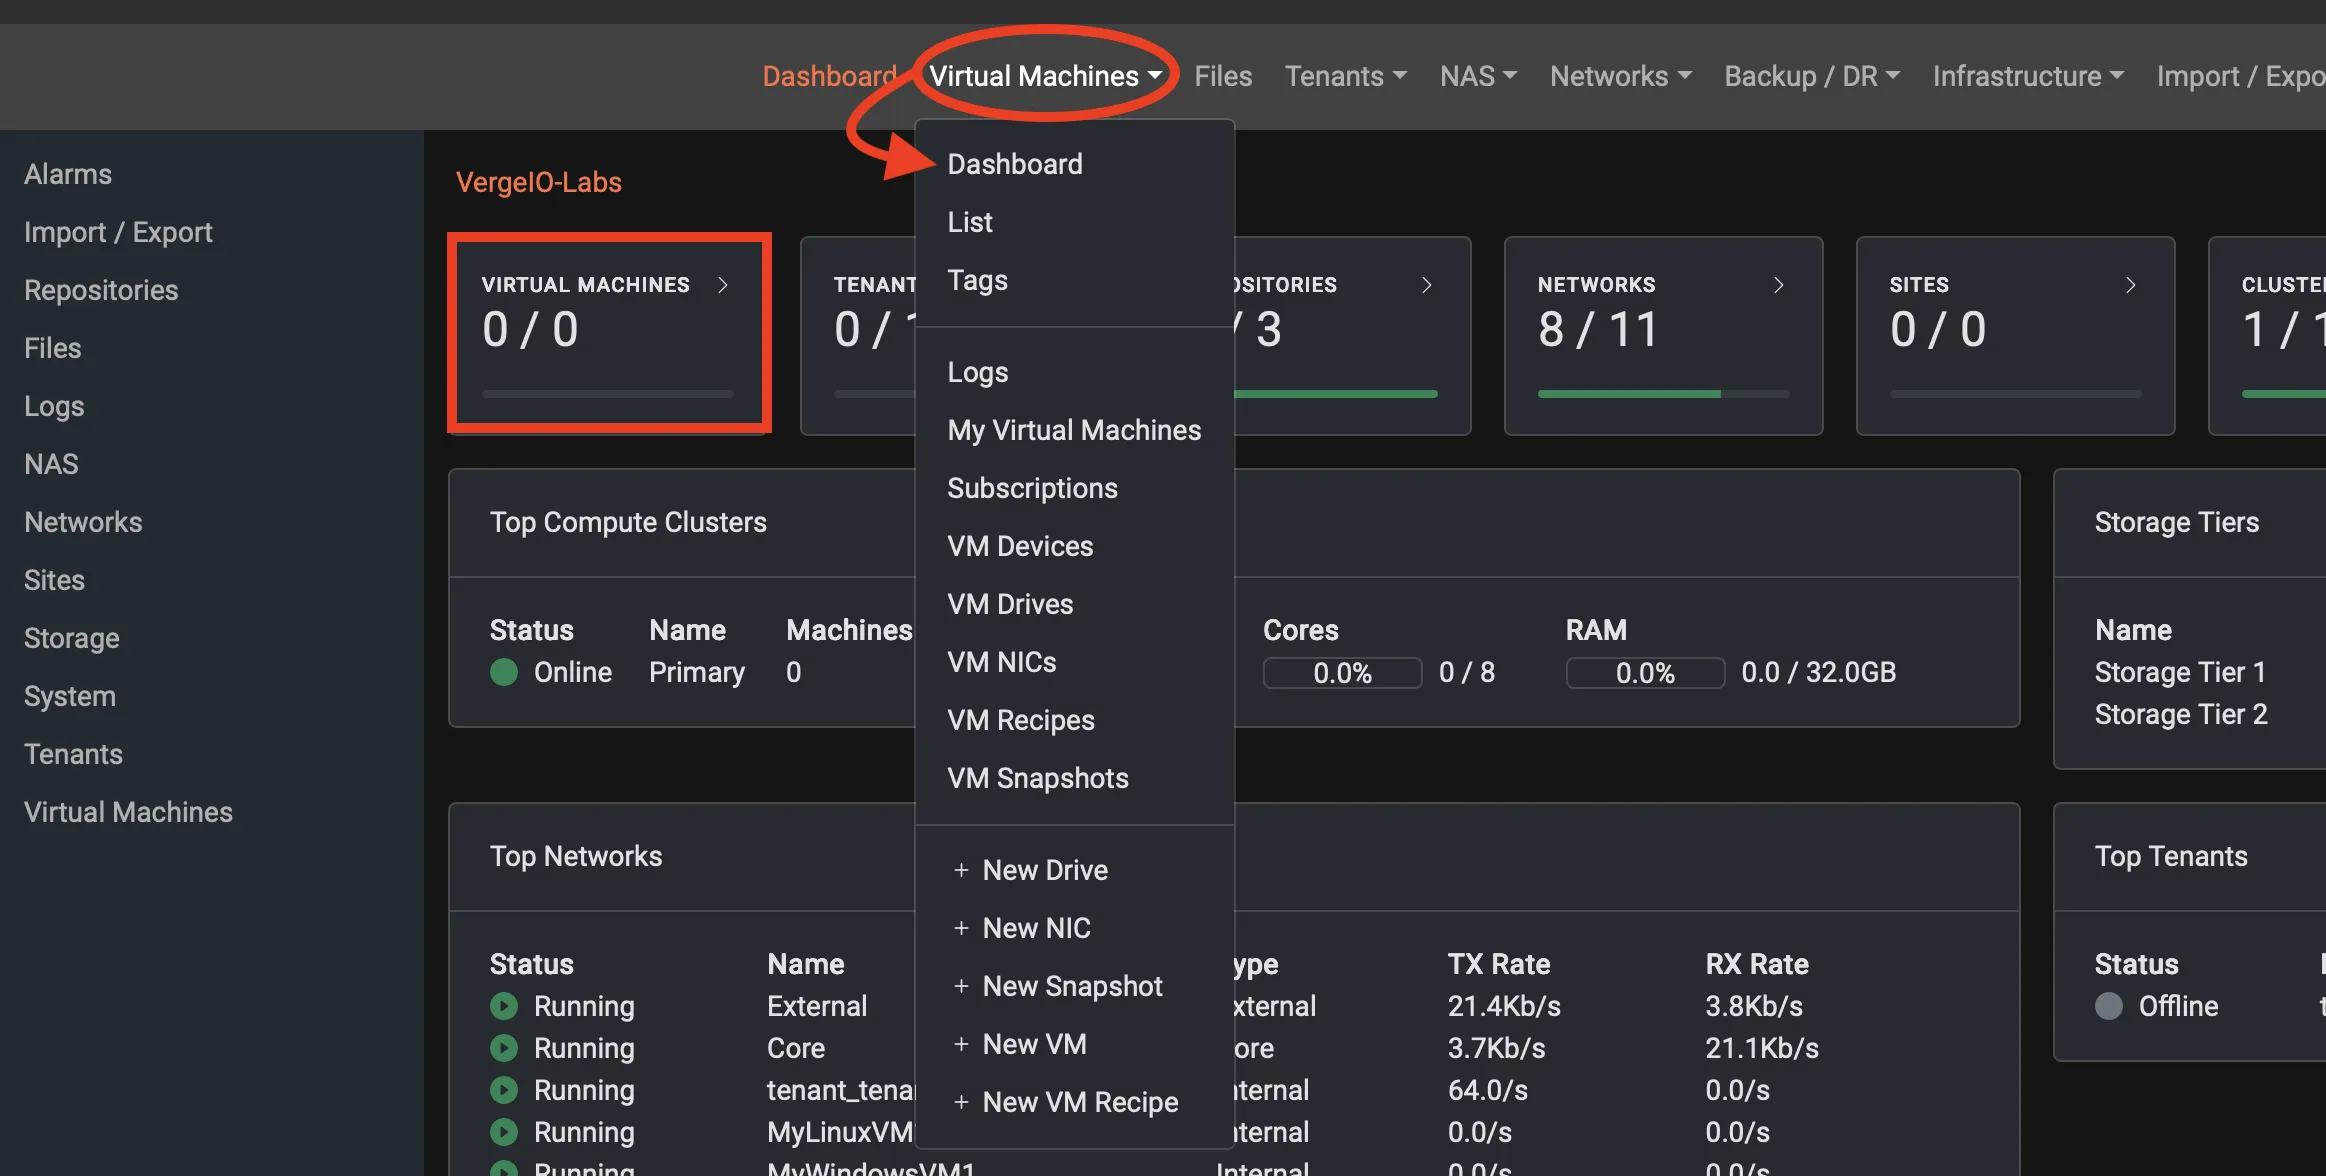
After selecting Virtual Machines from the main dashboard, you’ll arrive at the VM Dashboard, which provides a summary of your virtual environment. The top section displays totals for virtual machines, drives, NICs, devices, snapshots, and active consoles. Below, performance panels show CPU, network, and drive activity, while the Snapshots Expiring Soon section highlights any snapshots nearing expiration. The Logs panel at the bottom records recent VM and snapshot activity for easy tracking and verification.
Creating a Windows VM
First, we’ll create a Windows virtual machine. From the Virtual Machines Dashboard, open the Virtual Machines detail view by either selecting Virtual Machines from the context-sensitive sidebar or clicking directly on the Virtual Machines card. This will take you to the Virtual Machine Detail, where you can begin creating your new VM.
The Virtual Machines detail screen lists all VMs within the selected environment along with key attributes such as status, name, description, cores, allocated and used disk space, RAM, operating system, compute cluster, assigned snapshot profile, and host node. Each column can be filtered or searched to locate specific machines or configurations quickly. Right now, the screen is empty because no virtual machines have been created yet—but we’ll fix that shortly by adding our Windows VM.
Select "New" from the left context sidebar to start creating a VM.

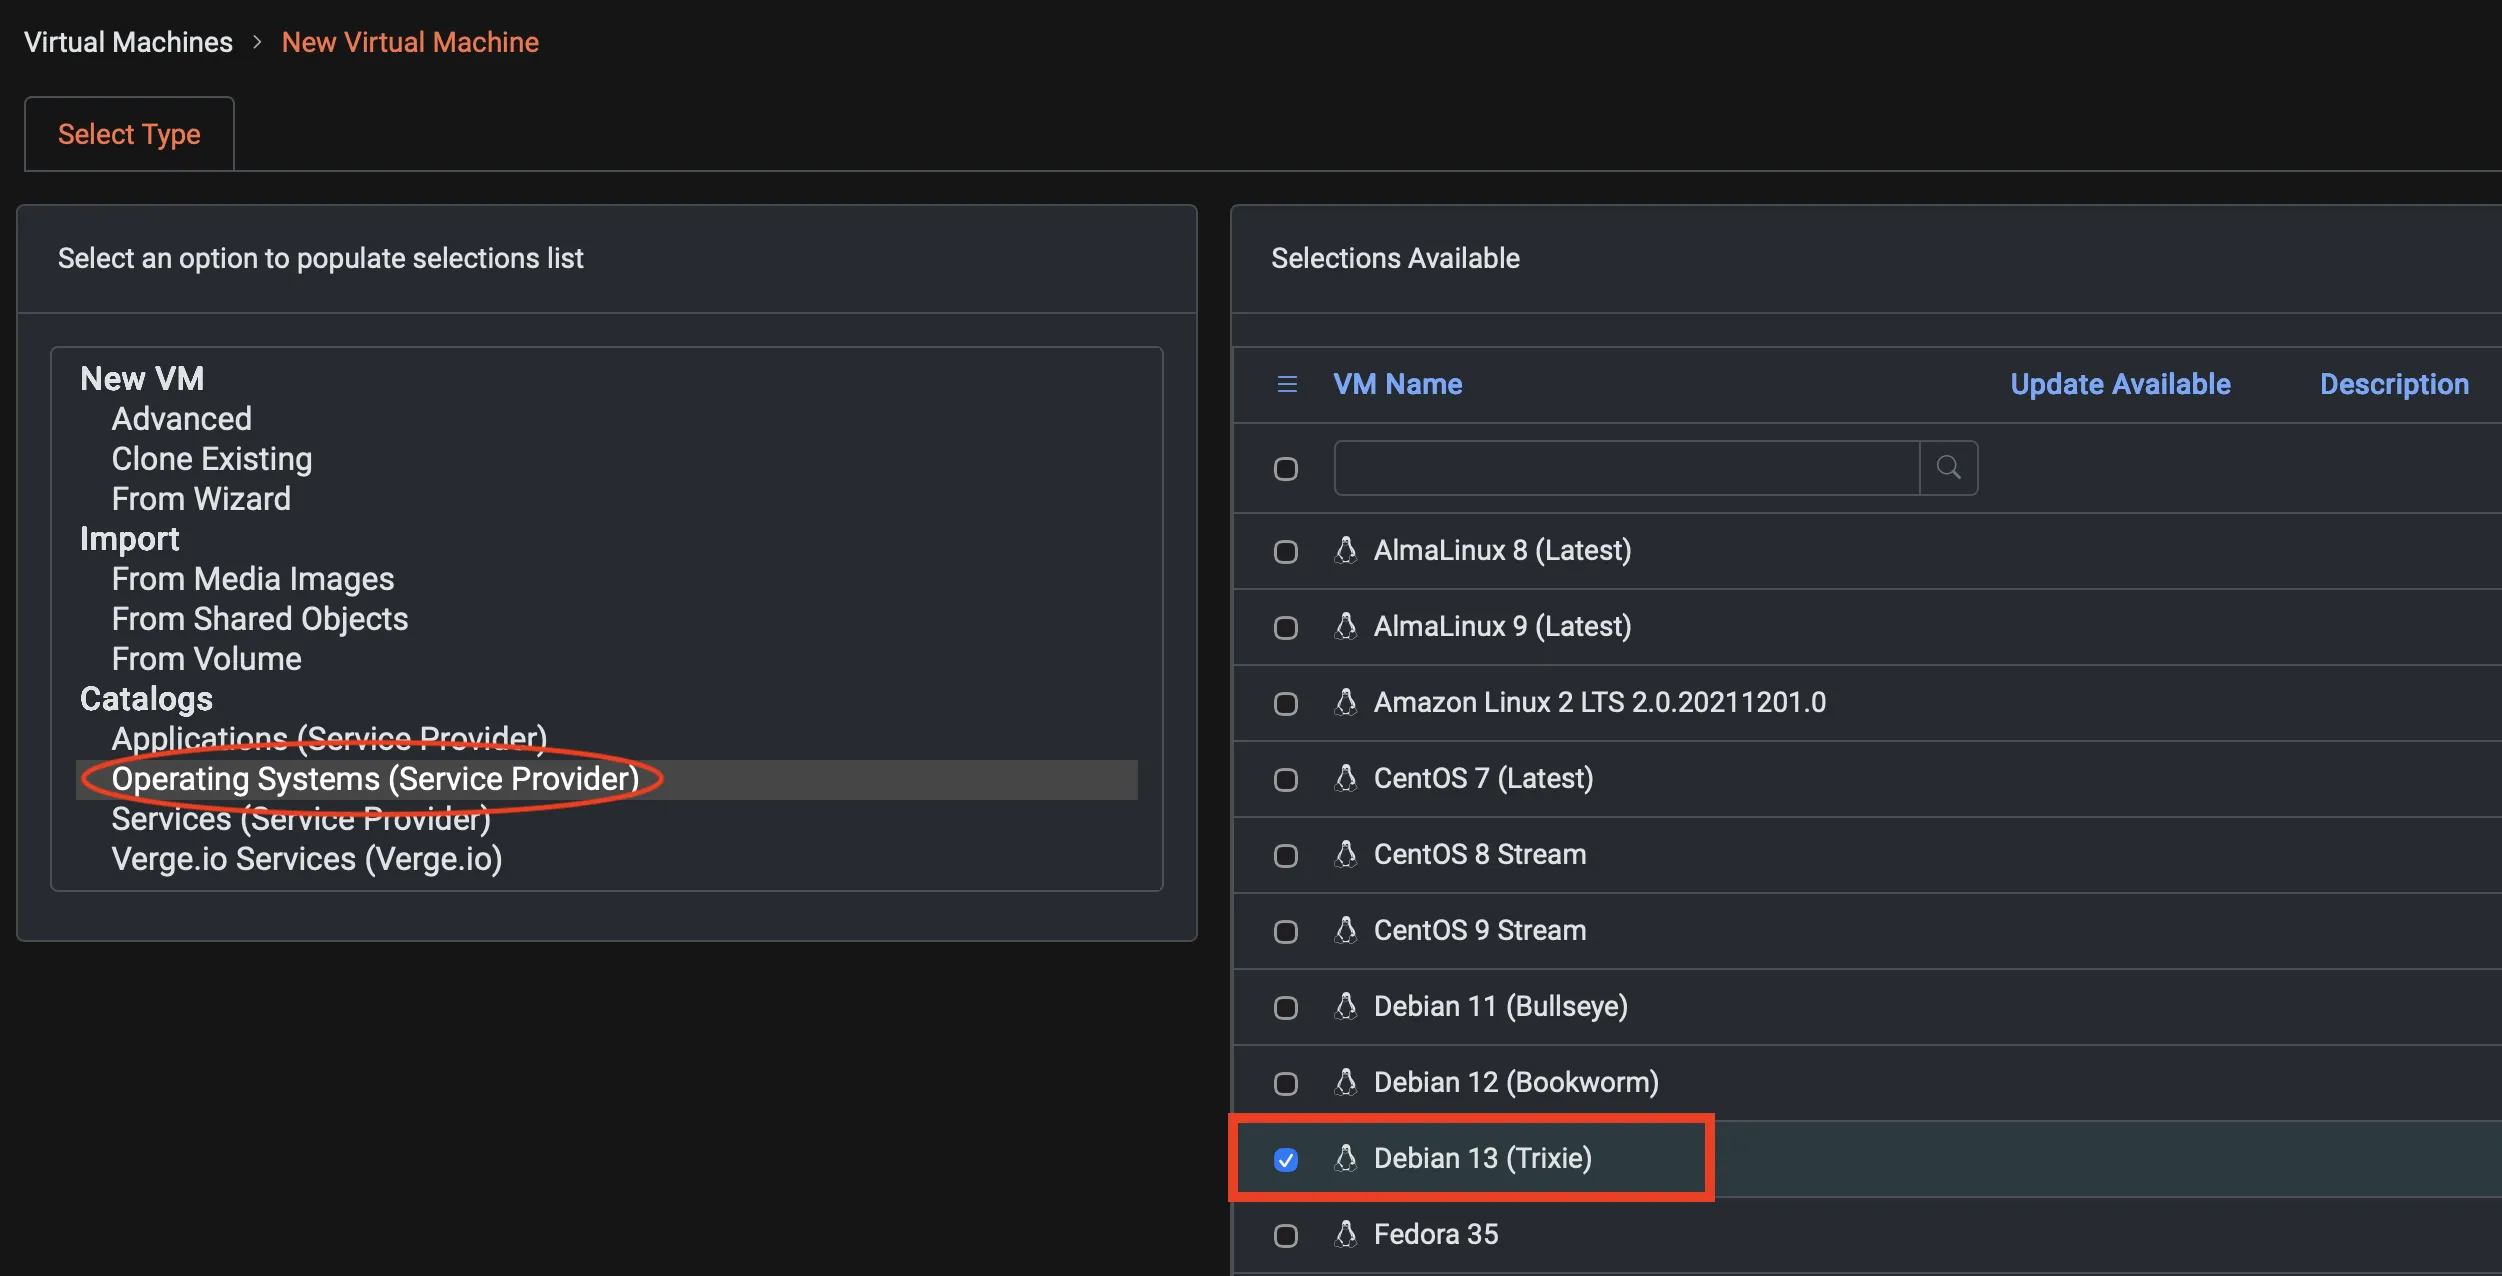
The New Virtual Machine screen is where you define how a new VM will be created. On the left, you’ll see several creation options, including New VM, Clone Existing, Import, and various Catalogs. In this example, the Operating Systems (Service Provider) catalog is highlighted, showing a list of preconfigured operating system templates available for deployment. The right-hand panel lists these options—such as Windows Server and various Linux distributions—along with details like version, update availability, and description. This view allows you to quickly select a base image or OS template to simplify and standardize VM creation.
Because the list of available operating systems is extensive, type “Windows” into the search box and click the search icon. This will quickly filter the catalog to display only Windows-based templates, making it easier to select the appropriate image for creating your Windows virtual machine.


Select Windows 2022 - Evaluation and click Next.
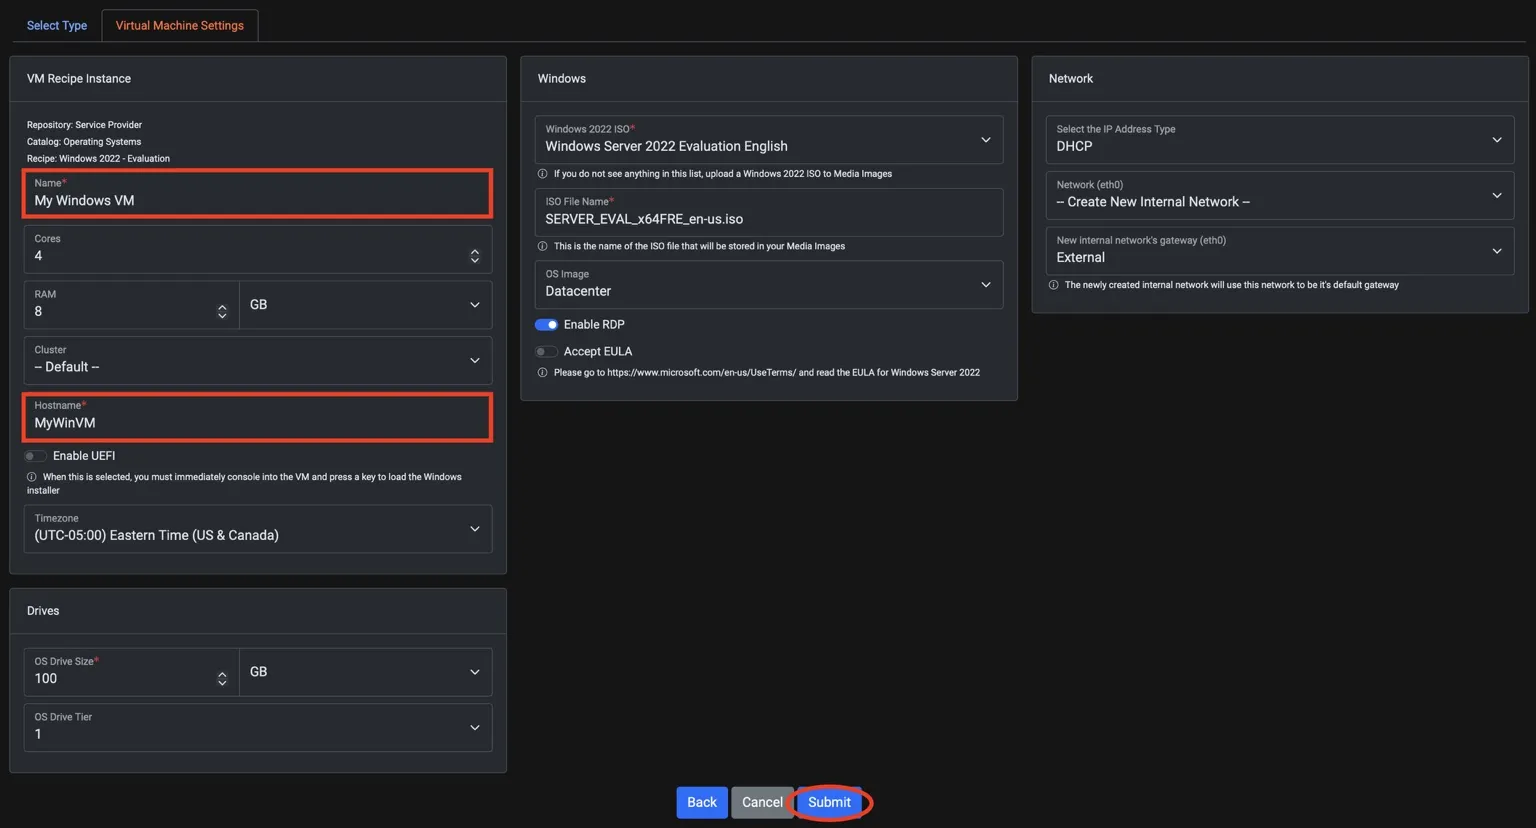
The Virtual Machine Settings screen is where you configure the parameters for your new VM before deployment. It’s divided into three main sections: VM Recipe Instance, Windows, and Network. The left panel defines core resources such as name, cores, RAM, cluster, hostname, and OS drive size. The middle panel contains Windows-specific options, such as the ISO file, OS image type, and toggles for RDP and EULA acceptance. The right panel manages network configuration, including IP assignment type and network selection.
For this lab, we’ll keep default settings and fill in the required fields:
Name: My Windows VM
Hostname: MyWinVM
Click: Submit
Powering on The Windows VM
The Virtual Machine Detail screen provides a comprehensive view of your VM’s configuration, resources, and current status. At the top, you’ll find summary metrics for drives, NICs, devices, snapshots, and system tasks. The main panels display detailed information such as CPU, RAM, OS type, hardware configuration, and boot order. You can also view and manage associated tags, attached drives, and network interfaces from this screen. Each drive and NIC includes its media type, interface, and performance statistics. The Logs section at the bottom records all recent actions and system events related to the VM. Because there’s so much information available, you may need to scroll down to see all details and configuration options.
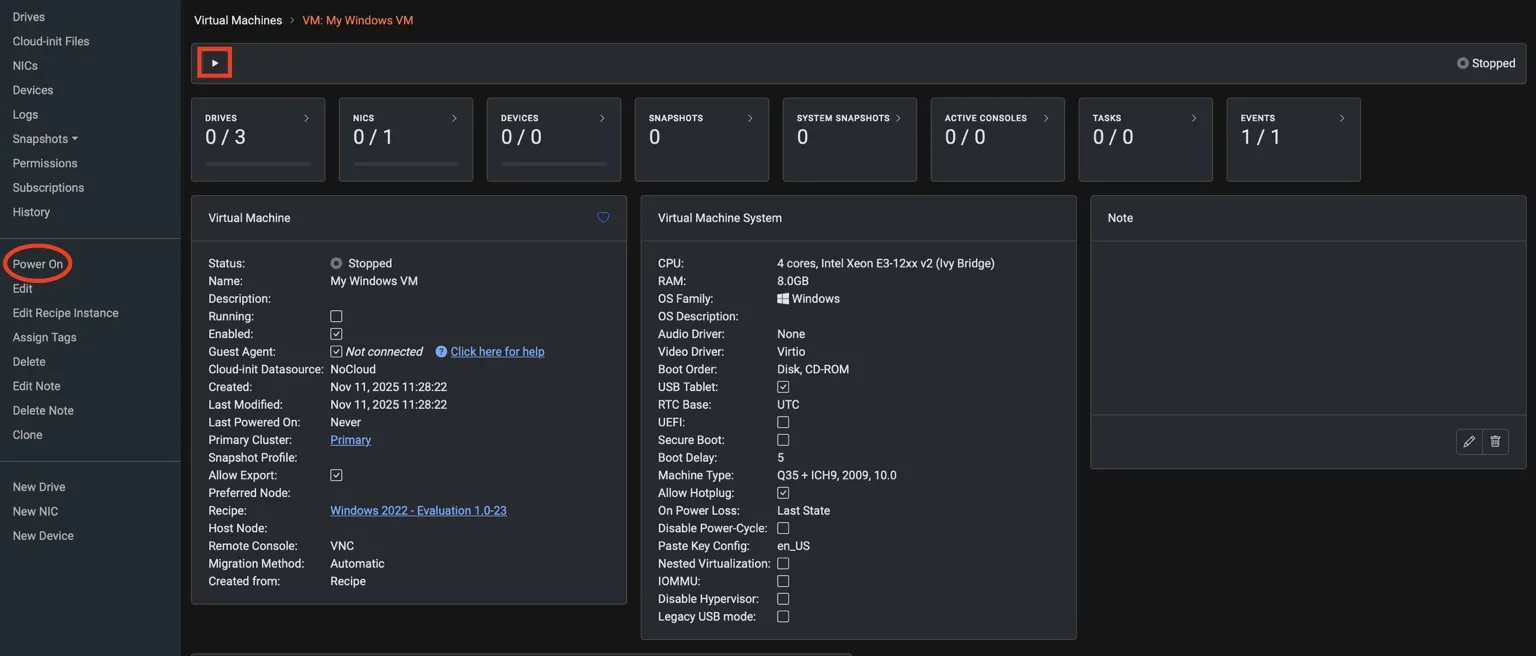
Now it is time to power on your VM. Click the "Play" button on the Virtual Machine's detail screen, or select Power-On from the left-side context menu.
When the confirmation box appears, select Power On.
Accessing Your Windows VM
To access the virtual machine’s display and complete the Windows installation, click the Remote Console icon at the top of the screen (highlighted in red) or select Remote Console from the left-hand context menu. This will open an interactive console session that lets you view and control the VM directly, as if you were sitting at its physical keyboard and monitor.
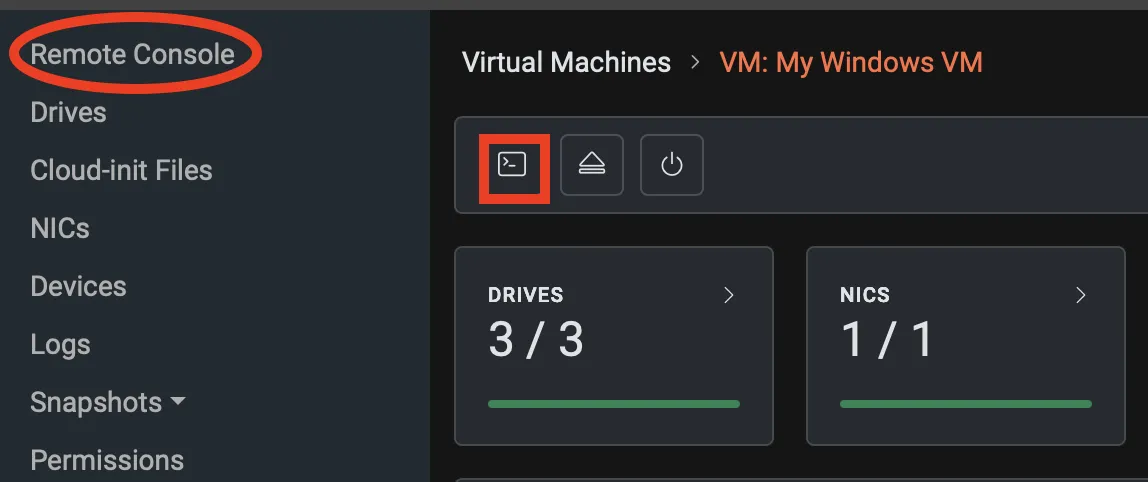
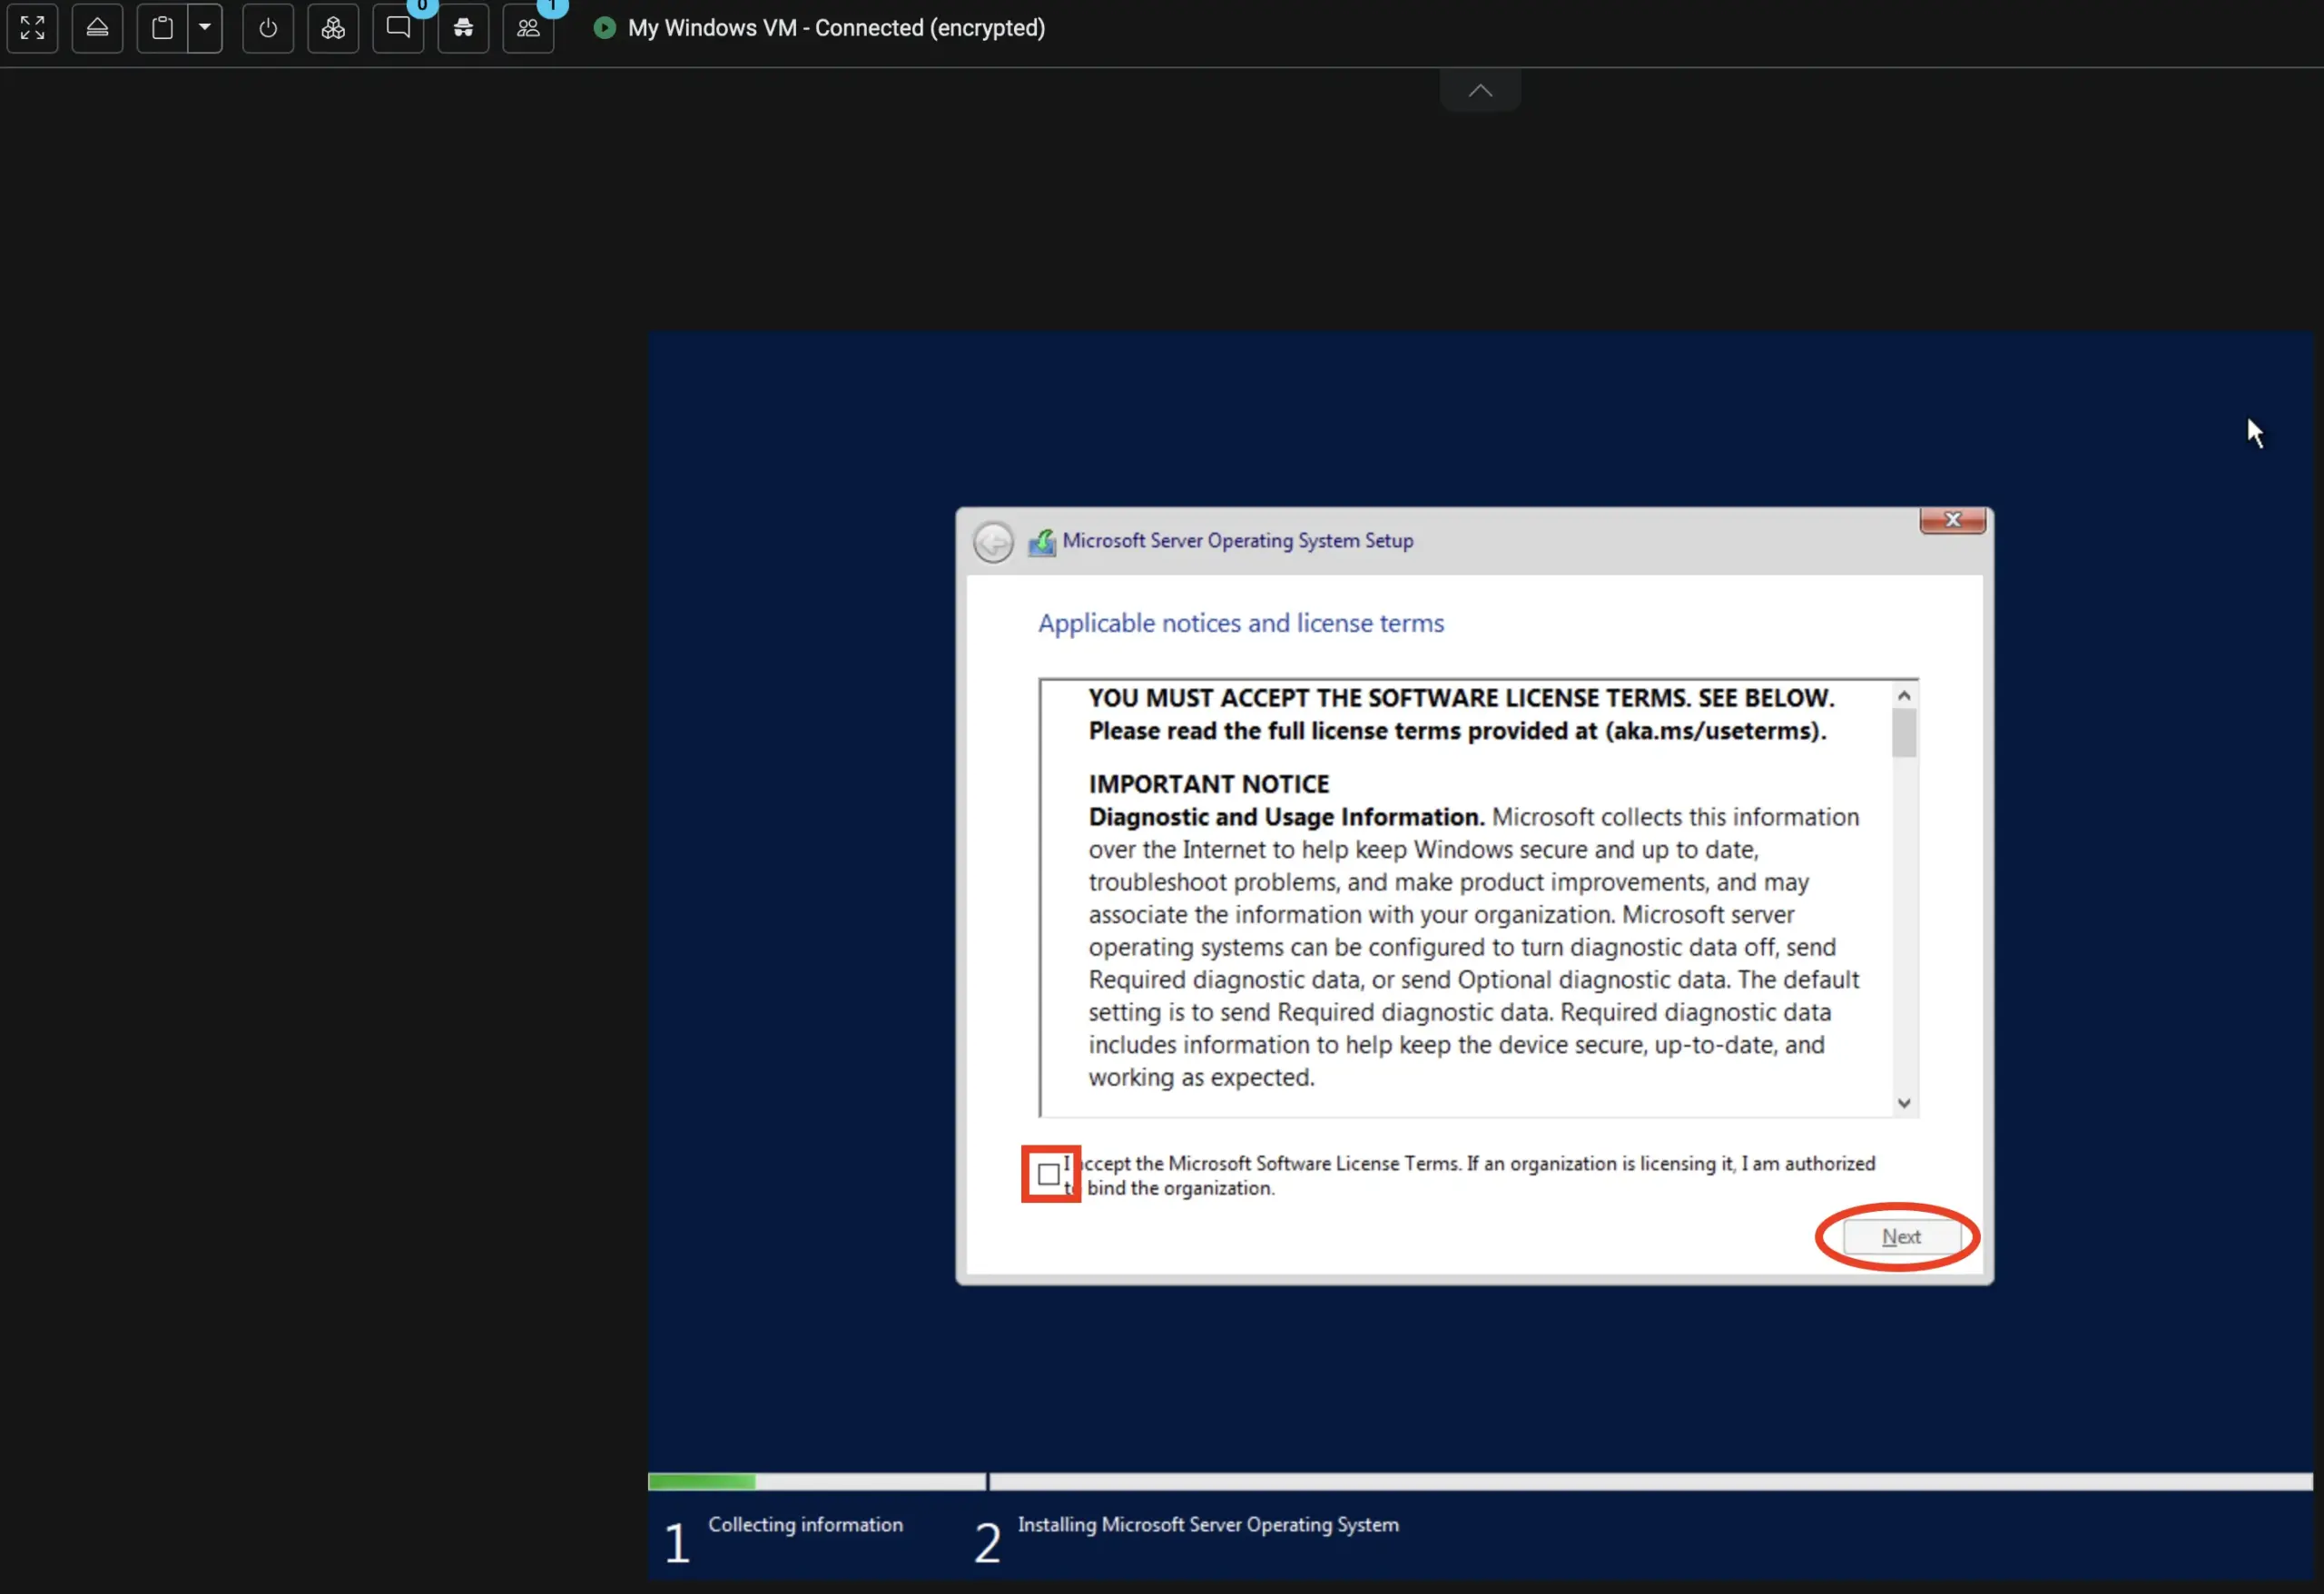
After selecting the Remote Console option, a new tab will open in your browser displaying the VM console window. This connects you directly to your Windows virtual machine so you can complete the installation process. At this stage, the Windows setup wizard will appear. Review the information presented, then check the box to accept the Microsoft Software License Terms before clicking Next to continue with the installation.
The Windows installation process will take a few minutes to complete. While that’s running, we’ll move on to creating a Linux virtual machine. To do that, click back to the VM: My Windows VM tab in your browser—it should be located directly to the right of the My Windows VM Console tab.
This will return you to the Windows VM detail screen. You can scroll down and see the Windows installation process consuming CPU resources.
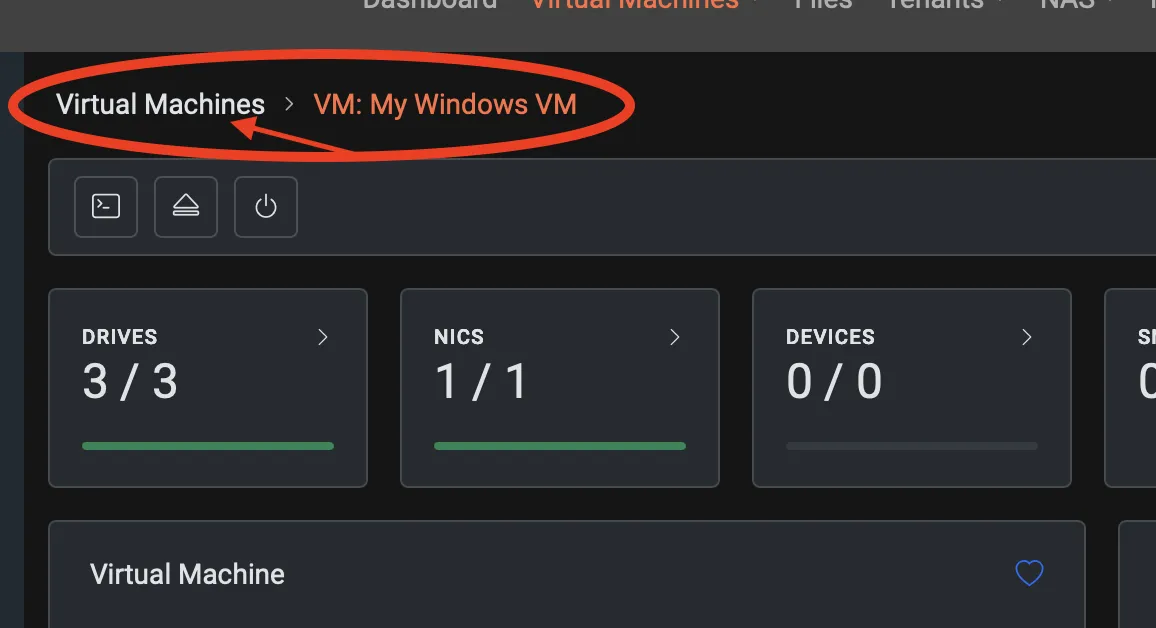
From here, we will use the VergeOS breadcrumbs underneath the primary menubar to navigate back to the VMs Overview Page.
Creating a Linux VM
From the Virtual Machines overview page, select New as before from the left context menu sidebar.

The operating systems listed on this screen are part of what VergeOS refers to as repositories. Each repository contains preconfigured OS images that are available for deployment when creating a virtual machine. These images are downloaded from the repository at the point of VM creation, ensuring that the latest version is used and eliminating the need to maintain large local image libraries. In this case, we’ve selected Debian 13 (Trixie) from the Operating Systems (Service Provider) catalog to use as the base image for our Linux VM.
With Operating Systems (Service Provider) highlighted, select Debian 13 (Trixie) and scroll down to click Next.
The Virtual Machine Settings screen for the Linux VM defines how the Debian 13 (Trixie) instance will be created. It’s divided into three main sections: VM Recipe Instance, User Configuration, and Network/Drives. The VM Recipe Instance section specifies basic configuration details such as name, CPU cores, RAM, cluster, and hostname. The User Configuration section lets you set up default credentials, including username, password, and an optional SSH key for remote access. The Network and Drives panels on the right handle IP configuration, network connections, and disk size.
For this lab, we’ll keep the defaults and only fill in the required fields:
Name: My Linux VM
Hostname: MyLinuxVM
User Name: admin
Password: password
Confirm Password: password
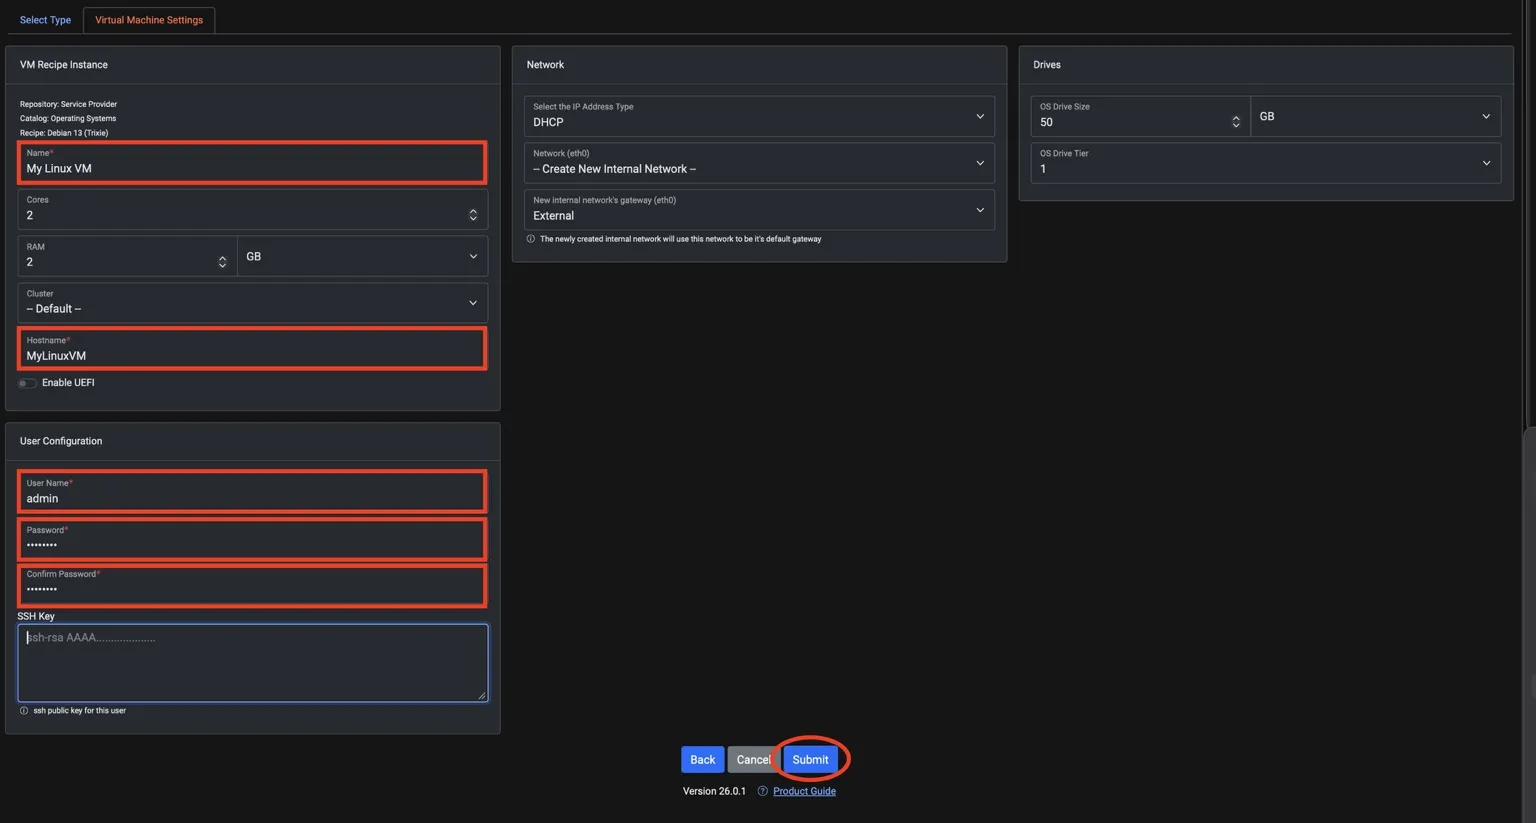
Click Submit when you've completed filling in the fields
Just like when we created the Windows VM, clicking Submit brings you to the My Linux VM detail screen. This view provides a complete summary of your new virtual machine, including system specifications such as CPU, RAM, and OS family, along with configuration details like boot order, network interfaces, and attached drives. You can also see assigned tags, snapshot profiles, and connection details for the remote console.
To start the VM, you can either click the Play button at the top of the screen or select Power On from the left-hand context menu. Confirm the Power-On in the pop-up dialog.
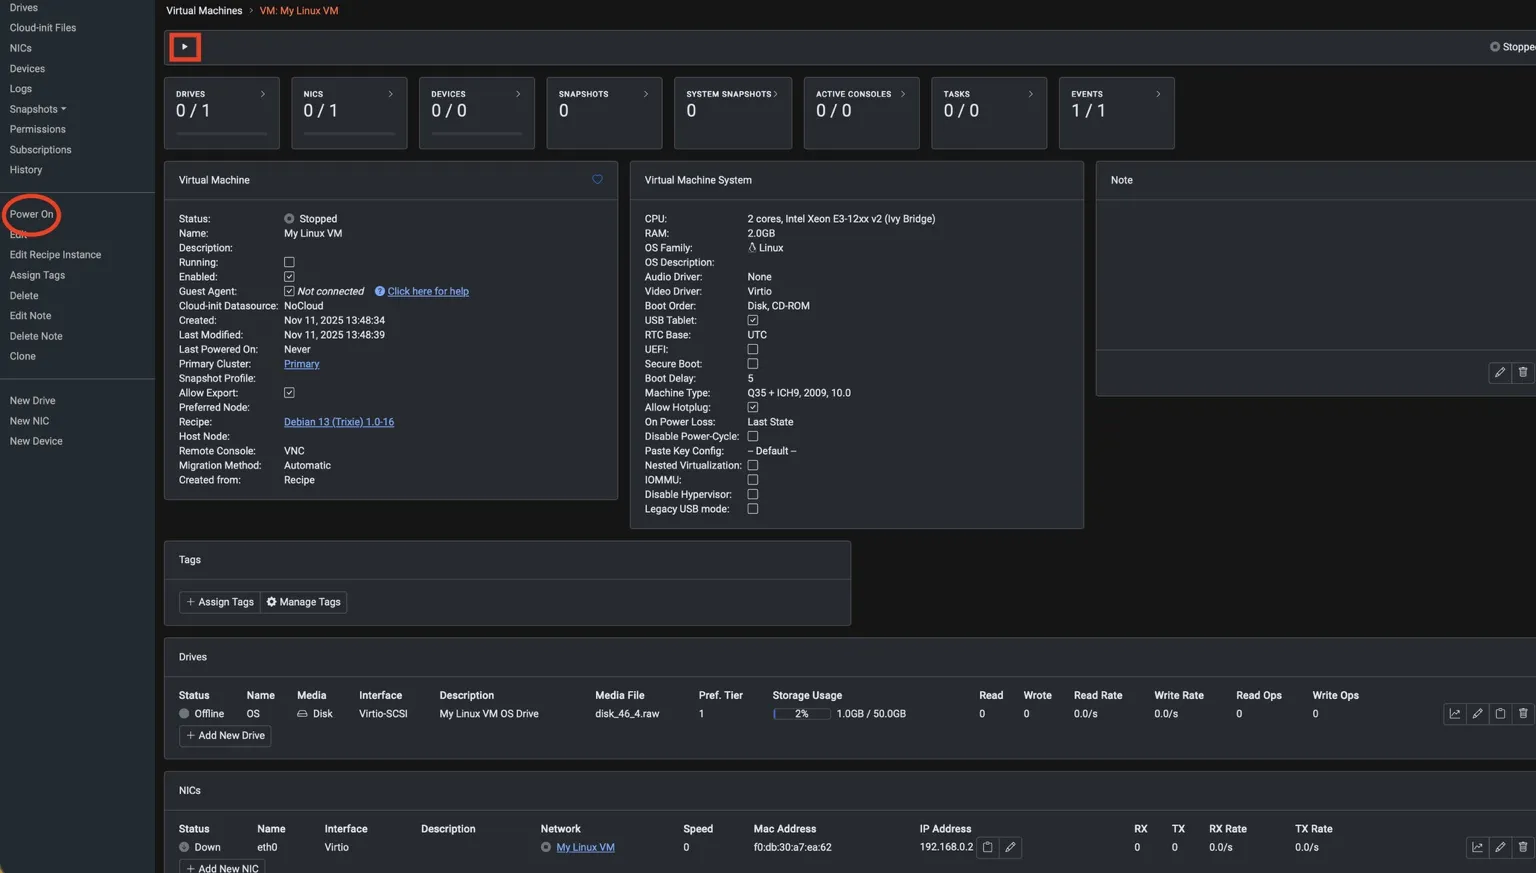
Just like with the Windows VM, we’ll now connect to the Linux VM using the Remote Console. You can do this by selecting Remote Console from the left-hand context menu or by clicking the Remote Console icon at the top of the Virtual Machine’s detail screen. This will open a new browser tab and launch an interactive session that lets you view and control the Linux VM directly.

Switch to the newly opened browser tab labeled Linux VM Console. This is the interactive console for your Debian virtual machine. When prompted, log in using the credentials you configured earlier — enter admin as the username and password as the password.
Once logged in, you’ll see the command prompt confirming access to your running Linux environment.

⚠️ When typing the password in the Linux console, you won’t see any visual feedback—no characters, dots, or movement on the screen. This is normal behavior for Linux systems.
By now, the Windows VM installation should be complete, and it’s ready for login. Switch back to the My Windows VM Console tab to finish the setup and sign in.
⚠️ If you’ve closed the Windows console tab, return to the VM: My Linux VM tab and use the breadcrumb navigation at the top to click on Virtual Machines. This will take you to the Virtual Machines Overview screen, where all your VMs are listed. From there, double-click the My Windows VM entry, then either select Remote Console from the left-hand context menu or click the Remote Console icon at the top of the screen to reopen the console and complete the Windows login process.
At the top of the remote console screen, there is a series of buttons for interacting with the remote virtual machine. Select the Extra Keys button, then press Ctrl-Alt-Del to initiate the Windows login process.

Follow the standard Windows login process by supplying a new password and waiting for Windows to complete the boot process (remember this password as you will need it for future labs).
Part 4 - Tagging and Assigning Snapshot Policies
Assigning Our Snapshot Profile
switch back from the Windows Console tab to the VergeOS interface. We want to ensure everyone is on the same page, so let’s navigate to the VM Dashboard together. At the top of the screen, click the Virtual Machines dropdown menu, then select Dashboard. This will take you to the Virtual Machines Dashboard page, where we’ll continue the lab.
Next, we need to navigate to the Virtual Machines Overview page. You can get there in either of two ways:
-
Select Virtual Machines from the left-hand context menu, or
-
Double-click the Virtual Machines card on the main overview screen.
Either option will bring you back to the full list of VMs so we can begin applying tags and snapshot policies.
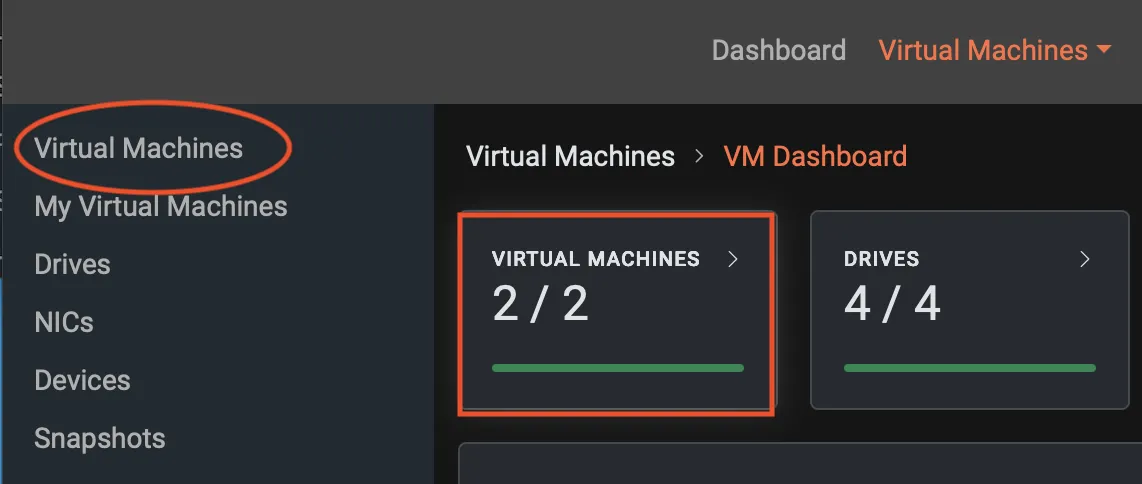
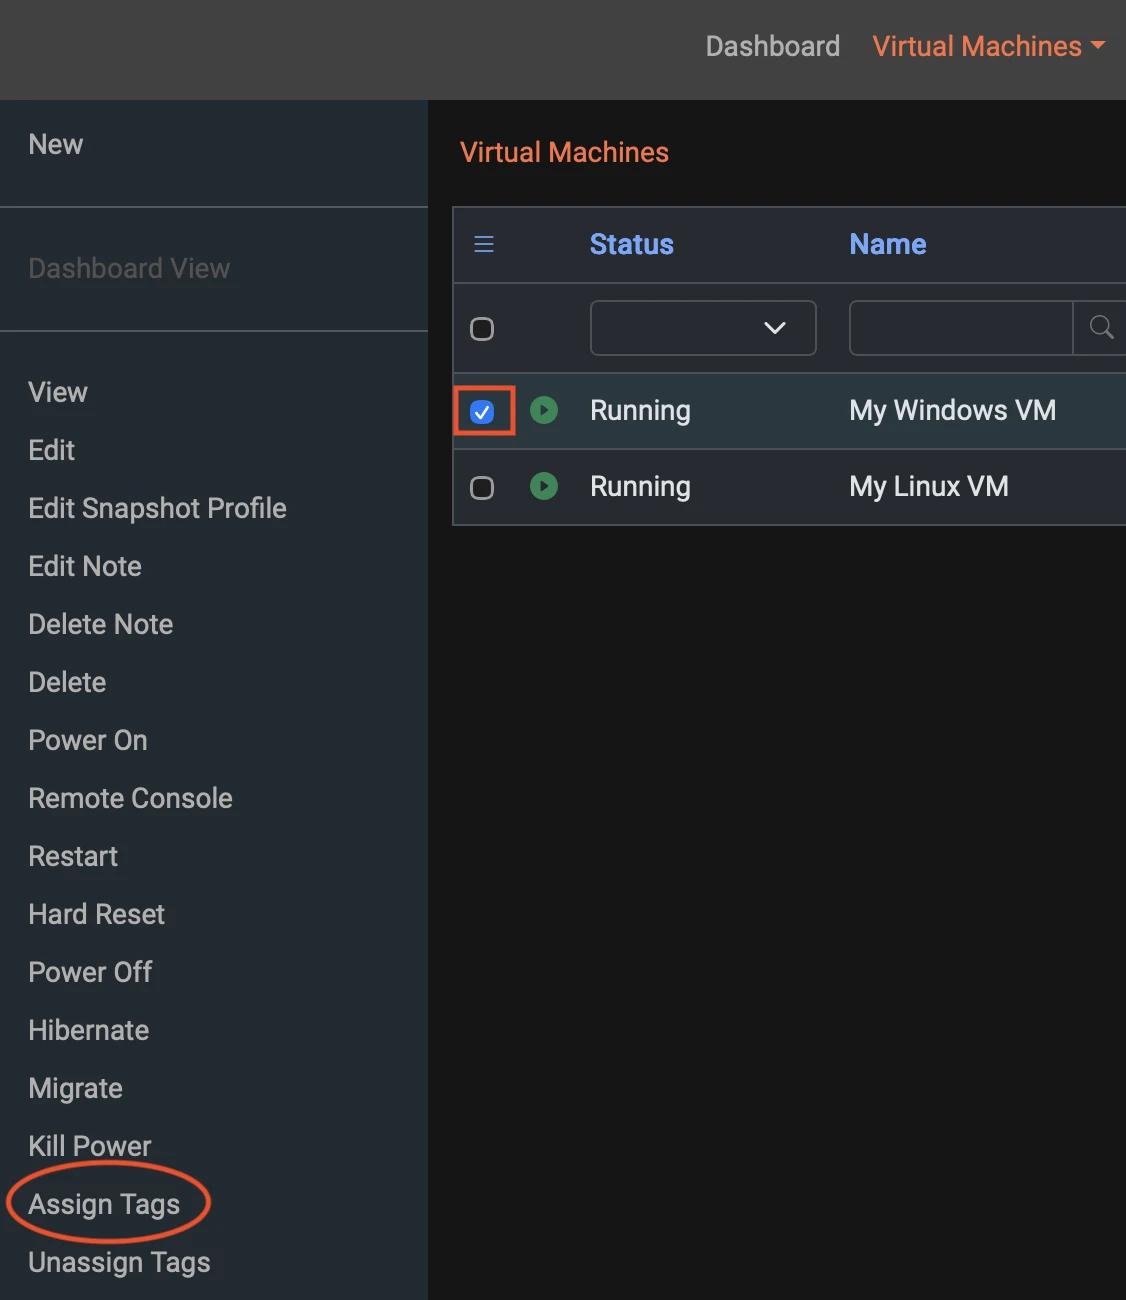
You should now see the two VMs we created, and both should be running. At this point, most options in the left-hand context menu remain greyed out because no virtual machine has been selected.
Since we want to assign the same snapshot policy to both VMs, please select them by clicking the checkbox next to each VM. Once both VMs are chosen, you’ll notice that most of the left-hand menu options become active.
From the left-hand context menu, click Edit Snapshot Profile to open the window where we’ll apply the snapshot policy.
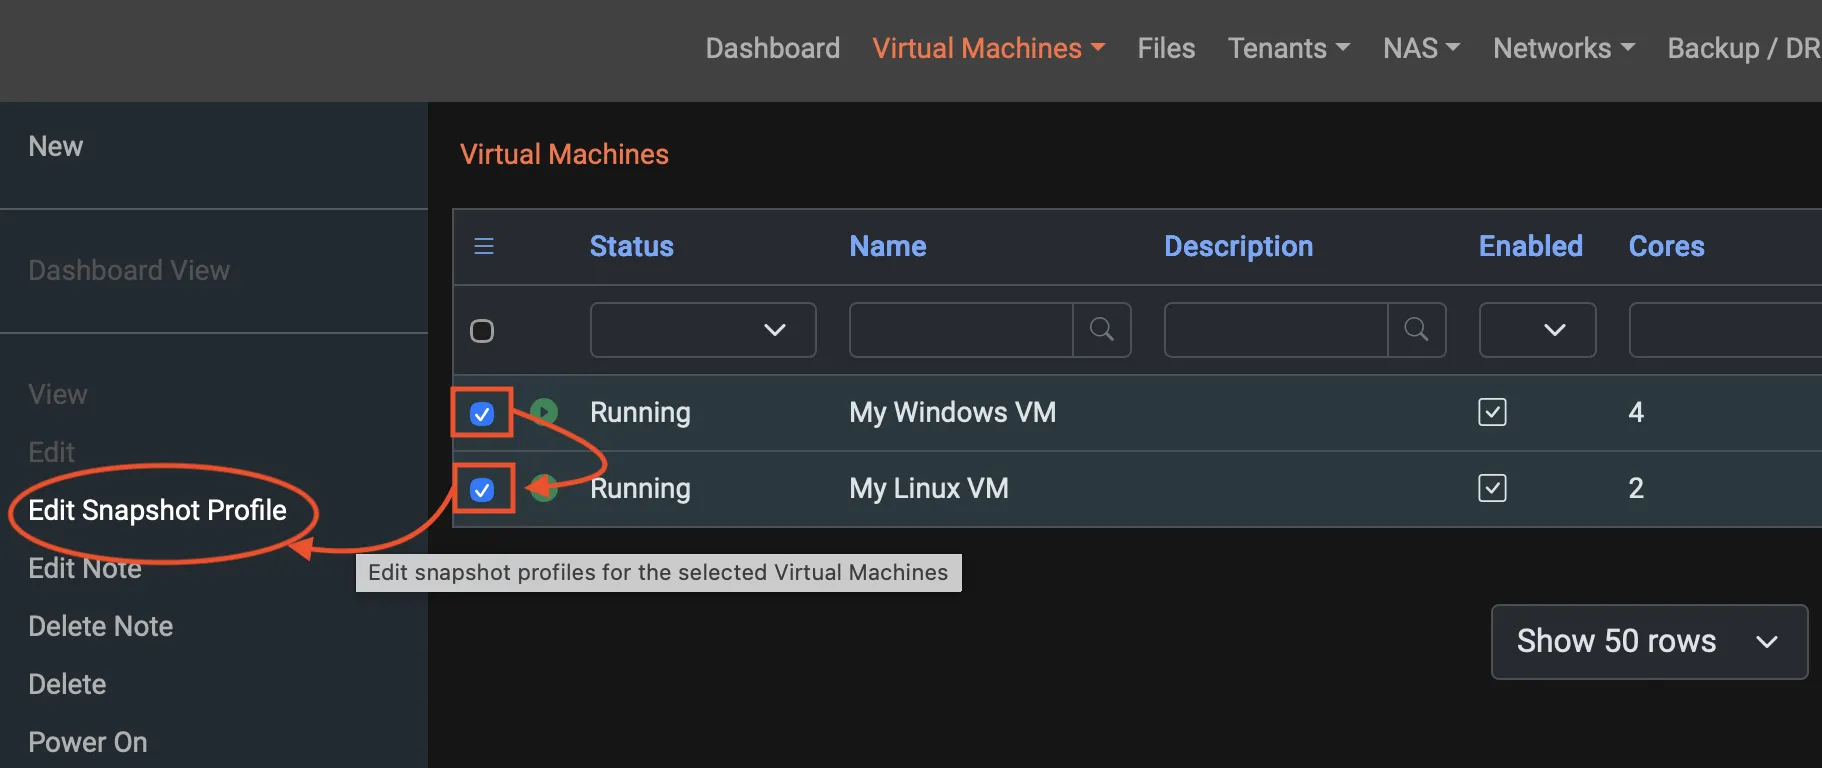
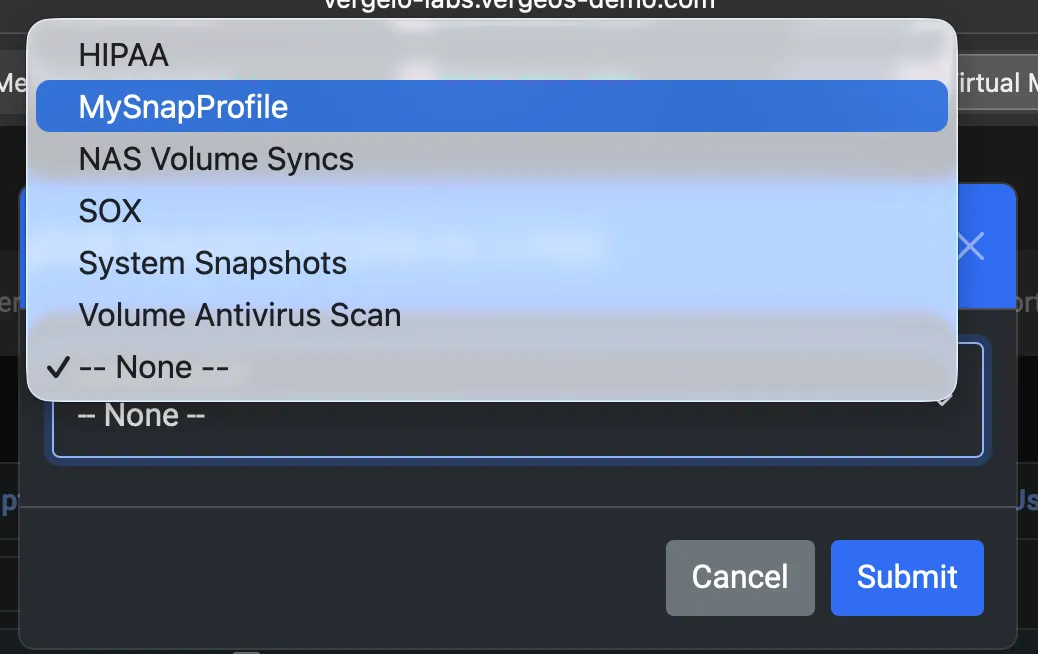
The Edit Snapshot Profile pop-up window will appear, and at the top, it should read “Edit Snapshot Profile for 2 VMs,” confirming that you have multiple virtual machines selected. By default, the Snapshot Profile field will be set to None. Click the dropdown menu in this pop-up to display the list of available snapshot profiles. From the options shown, select MySnapProfile, the profile you created earlier, and click the Submit button to assign it to both VMs.
After applying the snapshot profile, you’ll be returned to the VMs Overview screen. On the right side of the table, you’ll now see that each VM has the MySnapProfile snapshot policy assigned.
We’ll use these snapshots in a future lab to explore VergeOS recovery capabilities and demonstrate how quickly and reliably you can restore virtual machines and entire environments.


Congratulations! You have completed Course 1.
In this course, you successfully created and configured both Windows and Linux virtual machines, assigned snapshot policies, and applied tags using VergeOS. You navigated the main dashboard, explored the VM overview and detail screens, used the Remote Console, and worked with repositories and VM recipes. You also created a custom Snapshot Profile, applied it to multiple VMs, and verified your tag assignments through the System-level tag interface.
By completing these steps, you should now feel comfortable with the core workflow of VergeOS: creating VMs, managing policies, navigating the interface, and applying organizational metadata. These foundational skills prepare you for the next set of labs.
Now that you’ve completed Getting Started with VergeOS, you’re ready to dive deeper into core operational capabilities. Choose any of the labs below to continue learning:
2. VM Recovery Lab
Recover a failed or deleted virtual machine and see how VergeOS streamlines recovery operations.
3. File Recovery Lab
Learn how to restore lost or corrupted files from protected workloads using VergeOS built-in recovery tools.
4. VM Live Migration Lab
Experience seamless, real-time VM movement with no user disruption while workloads remain online.

